What is Microsoft Power BI?
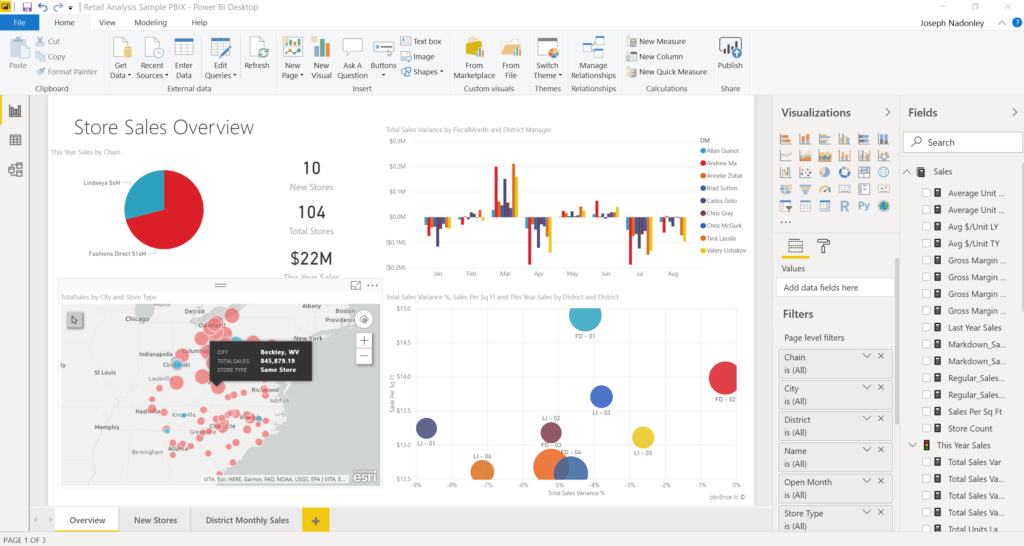
Power BI is an award-winning business intelligence tool created by Microsoft as a single hub for tracking and managing many diverse assets within a given organization. The Power BI platform consists of widget-based analytical tiles from both Microsoft and their various partners. These tiles allow for a simple, professional, and customizable visualization of otherwise unmanageable amounts of business data. The straightforward user interface and intelligent feature construction means that dashboard setup and asset management is now faster and easier than ever before.
Let Blue Raster create and optimize custom maps in Microsoft Power BI to give you more control over your data than ever before.

ArcGIS Maps Integration
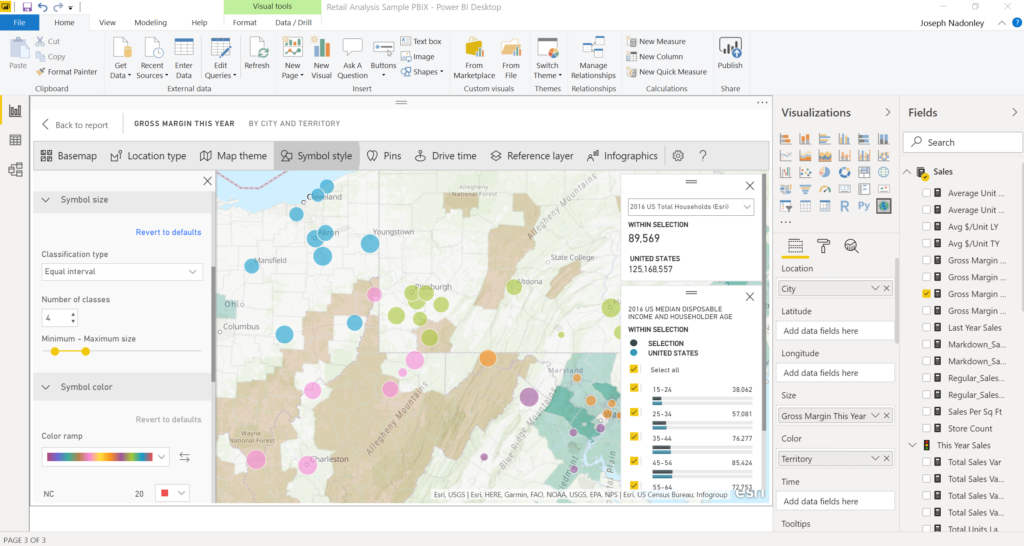
ArcGIS Maps within Microsoft Power BI contains many map-building elements that are similar to those found in other Esri products, such as ArcGIS Pro and ArcGIS Online. The configuration tab is highly user-friendly, featuring “drag & drop” field population and automatic detection of spatial data types. ArcGIS Maps for Power BI accepts both point and polygon data types. It can recognize fields that contain standard administrative boundaries (such as zip codes, counties, states, etc). Automated geocoding of point locations and polygon centroid calculation help to reduce the time and effort of spatial data management.

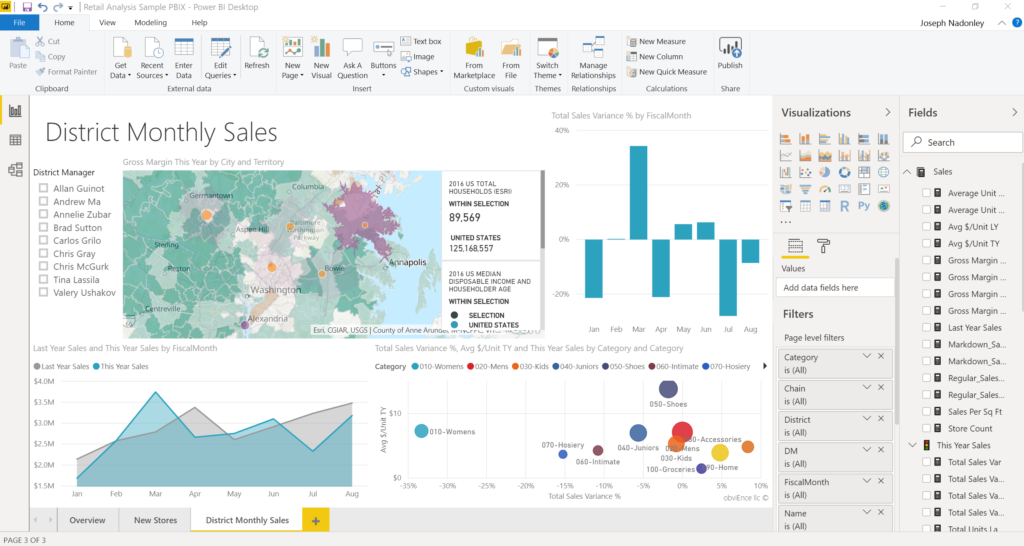
ArcGIS Maps for Microsoft Power BI provides basemaps and reference layers that are crucial to understanding the spatial context of business data. There are numerous basemaps to choose from to ensure a visualization that complements the symbology of spatially referenced assets. Changing the color schemes of data is also easy to do, with many hand-picked combinations and editable classification settings. Meanwhile, reference layers containing verified spatial data such as Median Household Income or Biodiversity Hotspots are great for showing the underlying geographic or demographic characteristics at any scale. Simple infographics cards display summaries of multiple key factors based on the extent of the map viewer.
The functionality of ArcGIS Maps for Microsoft Power BI also extends to light spatial analysis in the form identifying geographic patterns and relationships. Heat maps and clustering functions allow for the aggregation of data into overarching groups and regions, while location pins and drive time analysis help to evaluate smaller localities around individual assets. The maps editor even features support for temporal animation with a field that transfers time data into a dynamic map sequence.
Understanding the Geography of Business
Large companies with numerous clients, facilities, and/or assets often receive vast amounts of spatial data that go completely unused. ArcGIS Maps for Microsoft Power BI allows companies to harness the true potential of asset location in order to improve their business revenue and productivity.

This program takes data connection and shared business management to the next level. Any interaction or data selection within the ArcGIS Maps tile reflects in corresponding changes to data visualizations across all other analytical tiles. Collaboration is also easier than ever before, as Power BI allows users to share everything from individual figures to entire dashboards with just a few clicks.
Blue Raster is currently developing a Power BI dashboard and map application to visualize, analyze and track data and information for an important health project. The Tracking with Recency Assays to Control the Epidemic (TRACE) project is a new initiative that will contribute to the global fight to reach HIV epidemic control. Because the dashboard application needs to be accessible and usable by many users in many scenarios, the Blue Raster and TRACE teams decided on the ideal combination of Microsoft Power BI and Esri ArcGIS Online.
We are excited to grow our Power BI team and enhance our clients' business intelligence with the power of location data using ArcGIS Maps for Power BI.
Let Blue Raster kickstart your organization’s spatially integrated business dashboard. Contact us today!
- Posted in
- Power BI
- Development
