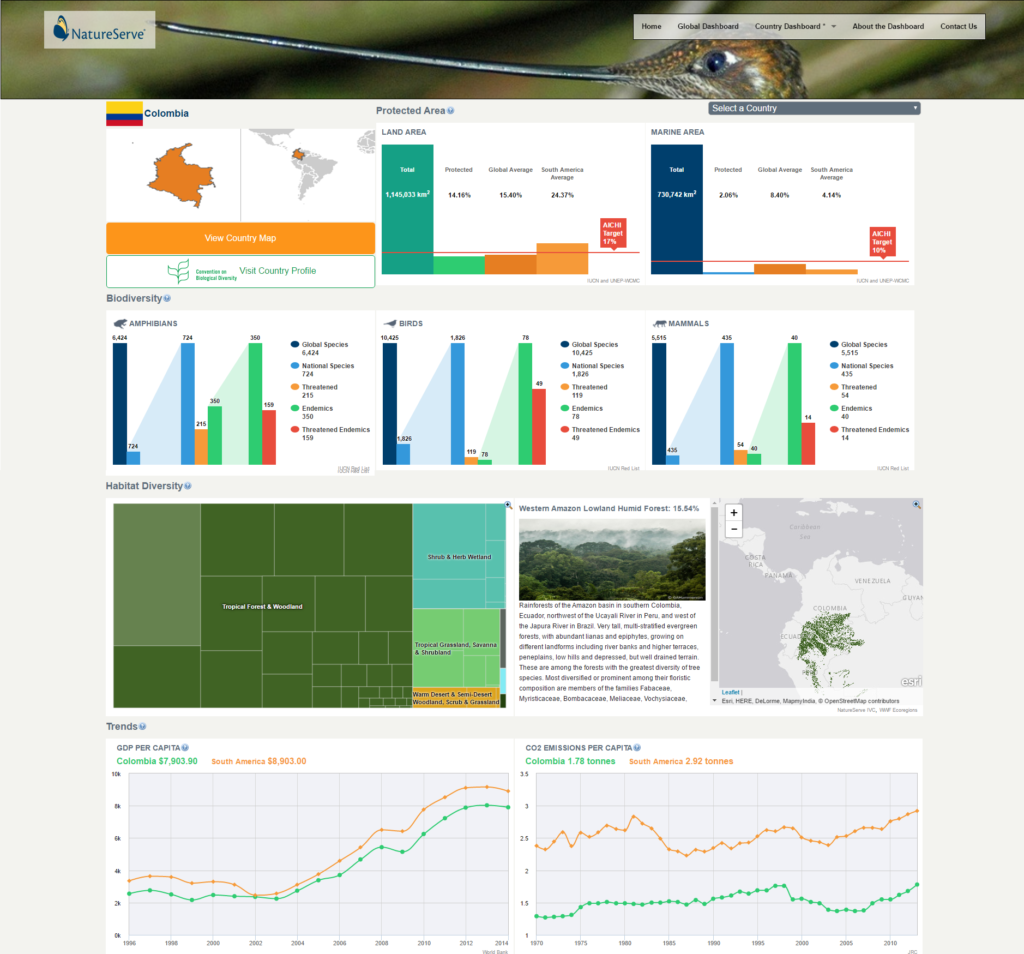
Every year, billions of dollars are invested in conservation actions across the world. The Biodiversity Indicators Dashboard displays trends in biodiversity, ecosystem services, threats, and conservation actions to help gauge how successful conservation efforts are and how pressures on biodiversity are changing. The Biodiversity Indicators Dashboard is a collaborative effort between Blue Raster and NatureServe technical, scientific and design teams.

- Protected Lands
- Endemic Species
- Threatened Species
- Habitat Diversity
- CO2 Emissions
 The dashboard leverages Drupal, HTML5, Esri Leaflet and D3 to bring users an informative mix of data and visualizations.
In 2016, Blue Raster was a proud sponsor of the Society for Conservation GIS (SCGIS) annual meeting- pictured here are Blue Raster’s Phil Satlof and Dr. Healy Hamilton, Chief Scientist at NatureServe and President of SCGIS.
- Posted in
- Environment
- Forest
- Nonprofit/NGO
