From its headwaters on the Tibetan Plateau, the Mekong River runs through six countries, China, Myanmar, Laos, Thailand, and Cambodia before reaching the ocean. Over 60 million people live in the Mekong watershed and rely on its natural resources and fish and agricultural products produced here are shipped throughout the world. However, recent evidence indicates that the operation of new upstream dams constructed in China are changing the natural flow cycle of the river, affecting downstream communities.

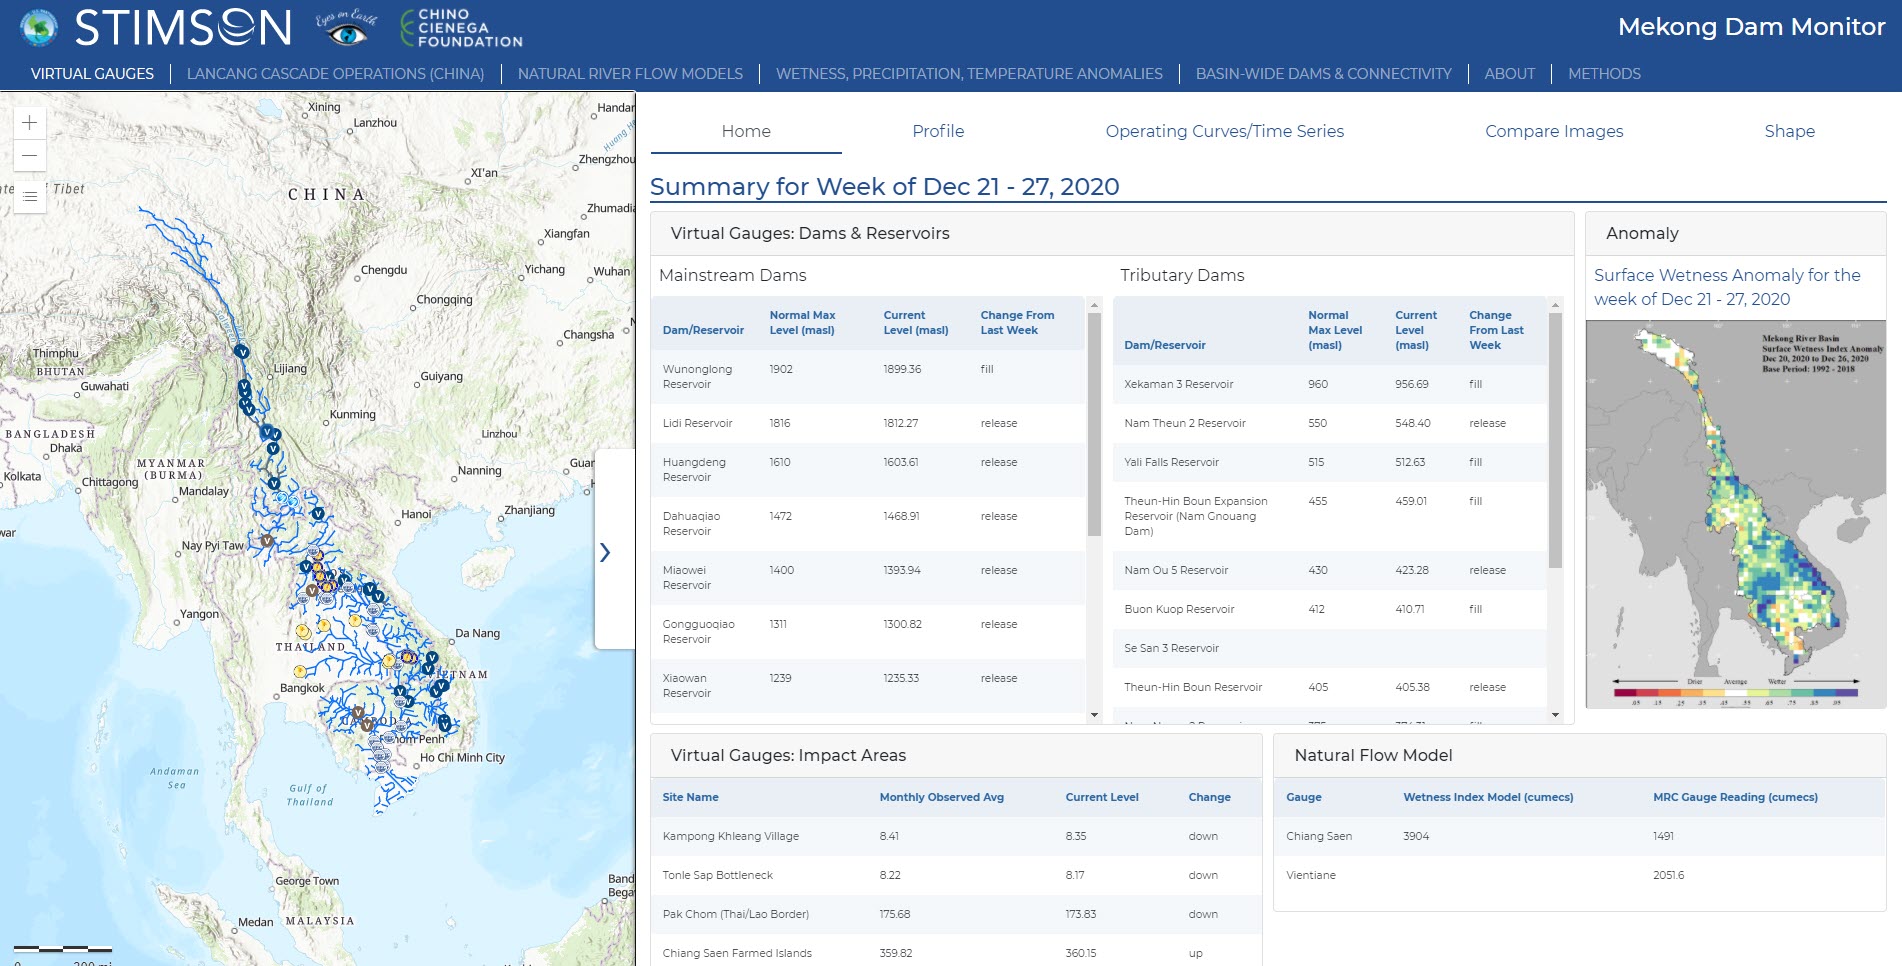
In spring 2020 a U.S. State Department-supported study by independent researchers at Eyes on Earth published a study showing that the upstream dams restricted enormous quantities of water in 2019, while downstream areas were experiencing an unprecedented drought. The newly launched Mekong Dam Monitor builds on that research to provide unprecedented transparency of the flow of water and conditions of dams and reservoirs along the Mekong River. The application was developed through a partnership between the Stimson Center’s Southeast Asia Program and Eyes on Earth, Inc with funding from the Mekong-US Partnership, and the Chino Cienega Foundation.
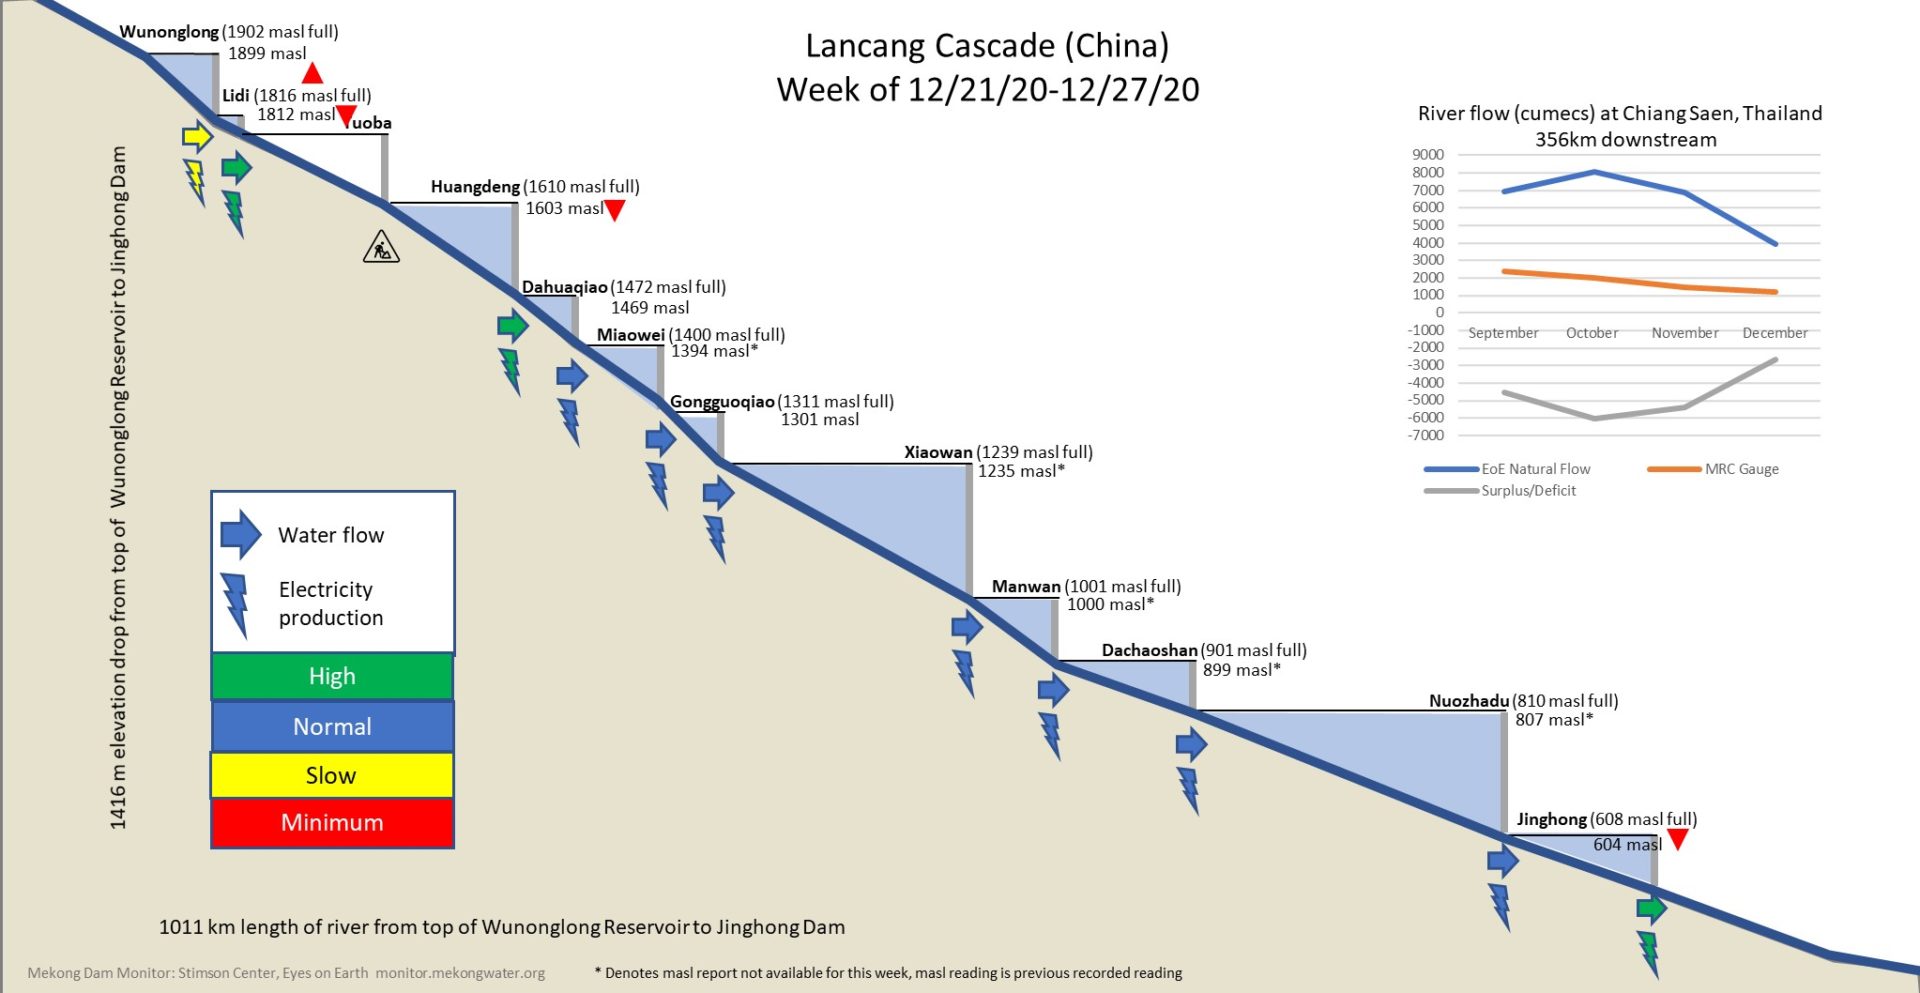
The Monitor includes multiple tools and indicators in a single platform, giving a comprehensive near-real time view of the current state of the Mekong basin along with historic conditions. Users can explore detailed information about dozens of dams and Impact Areas, including viewing satellite imagery, weekly reservoir level (meters above sea level), and inundated area, all estimated from remotely sensed data in the Virtual Gauges page. One tab over, the Lancang Cascade visualization shows the weekly state of water retention and power generation in each of China’s 11 upstream dam cascade. Just two dams in the cascade, Xiaowan and Nuozhadu can collectively hold nearly as much water as the Chesapeake Bay.
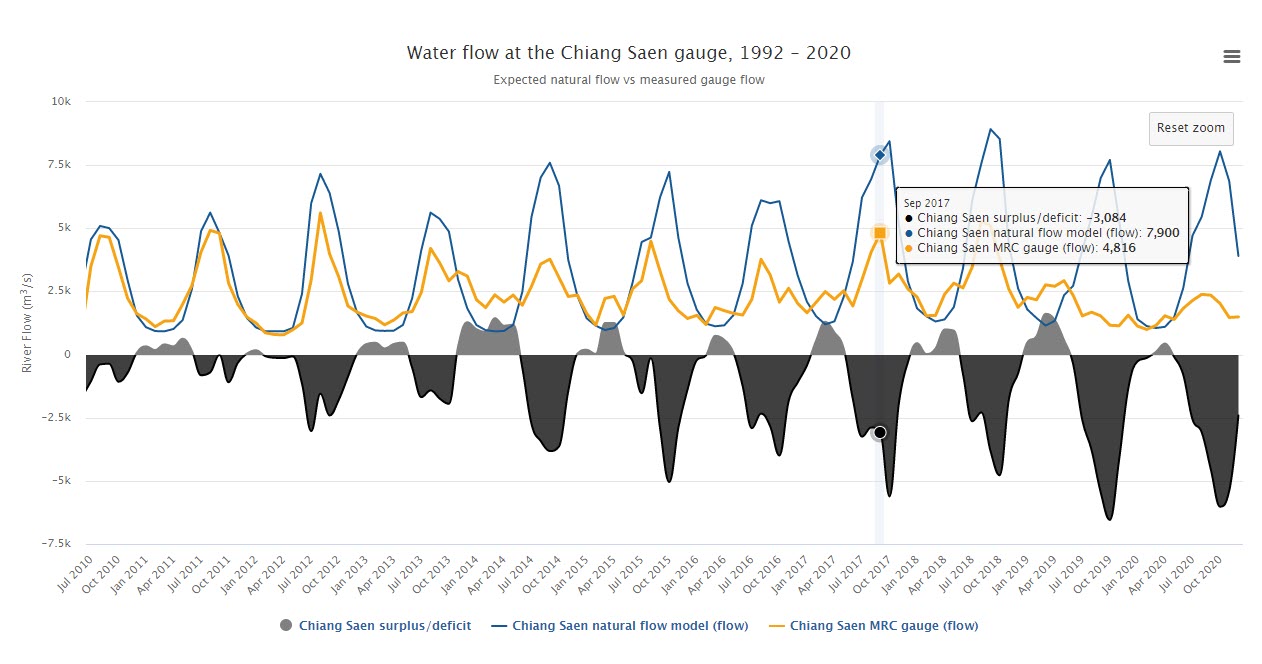
The Natural Flow Model visualizations leverage analysis by Eyes on Earth that predict the expected water in the Mekong River based on temperature and precipitation data derived from satellite imagery. These values are compared to actual flow rates measured at two locations by the Mekong Water Commission. The expected and measured flow rates diverge starting in 2012 with extreme differences in 2019 and 2020 when very little of the expected water from the rainy season passed the downstream gauges.
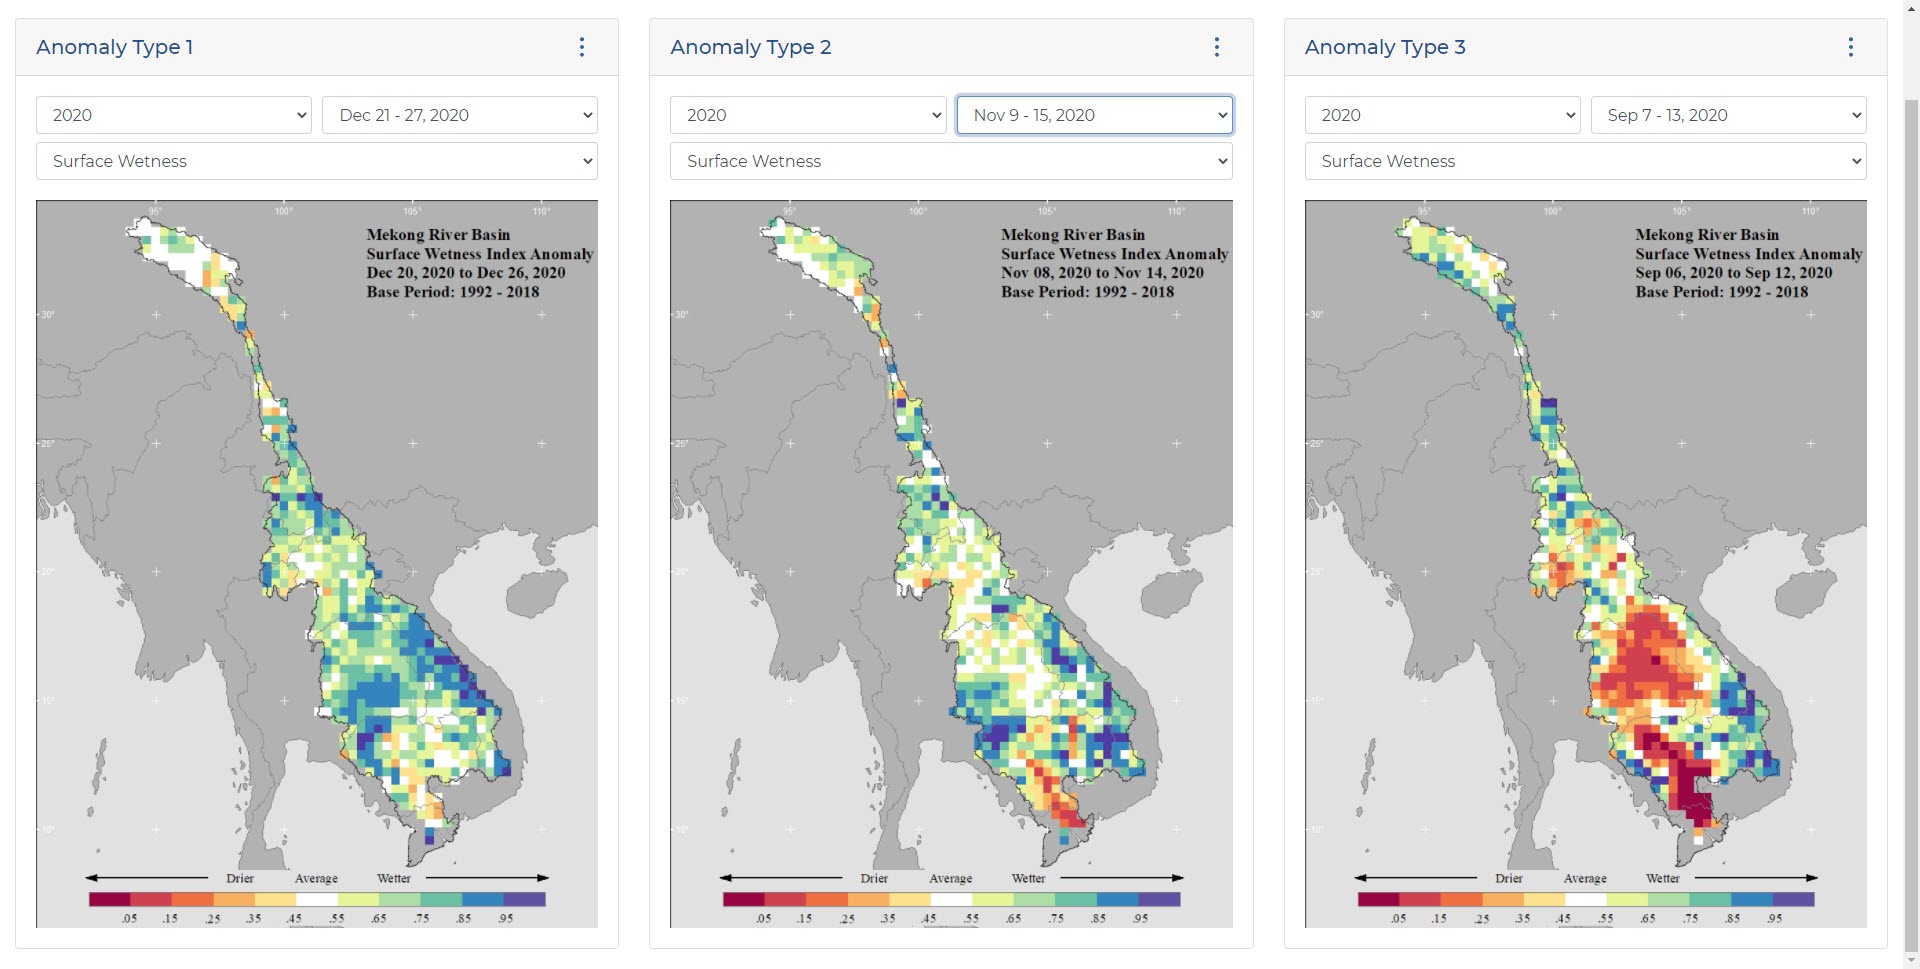
Additional data on climate anomalies, such as precipitation, snow cover, and temperature allow users to compare current and historic maps from 1992 to the present. Finally, the Basin Wide Dams and Connectivity page builds on the success of the Stimson Center’s Mekong Infrastructure Tracker Dashboard and provides comprehensive information about hydropower development in the region. This includes information about dam developers, financers, energy generation, and more.

The Mekong Dam Monitor was developed using the Esri JavaScript API and leverages data hosted in ArcGIS Online as well as ArcGIS Image Server.
Nearly all data shown in the Monitor is available for download for transparency. With this tool, stakeholders and policy makers will have a greater ability to anticipate environmental and social impacts of dam operations, adopt evidence-based policies for managing the Mekong River, and participate in transboundary river governance.
- Posted in
- Water
- ArcGIS Image Extension for Server
- ArcGIS Online
- Conservation
- Economic Development
- Environment
- Infrastructure
- JavaScript API
- Nonprofit/NGO
- Sustainable Development Goals
Related Posts
- Track Industrial Spaces in the Mekong Region with the Updated Mekong Infrastructure Tracker
- Mekong Infrastructure Tracker
- Mekong Monitor – Providing Vital Insight for River-dependent Communities
- Blue Raster Pioneering Imagery Management Technology and Delivery Workflows with ArcGIS
- Promoting Sustainable Forestry Practices with High Resolution Imagery


