Power BI enables anyone to connect to data and turn it into insights. It was built with the “citizen developer” in mind, meaning that users don’t need to have previous BI experience or know any complicated code. Making the shift from Excel to Power BI to display meaningful and actionable data is more simple than you might expect. Get started with your first Power BI report today!
Build Your Own Report
If you’re ready to get started, I recommend that you take a look at our October webinar, where we walk you through building your first report. You can access the source files here to follow along step-by-step, and if you get lost or want to see how we’ve done something, you can take a look at the sample Power BI desktop file.
Just this month, the Power BI team has made it easier for us to get started with the tool! In this post, I will walk you through how to build your first Power BI report using the sample data that comes included in the Power BI desktop tool! You can read Microsoft’s full update blog that includes other new features here.
1. Open Power BI Desktop (must be the October 2020 version*)
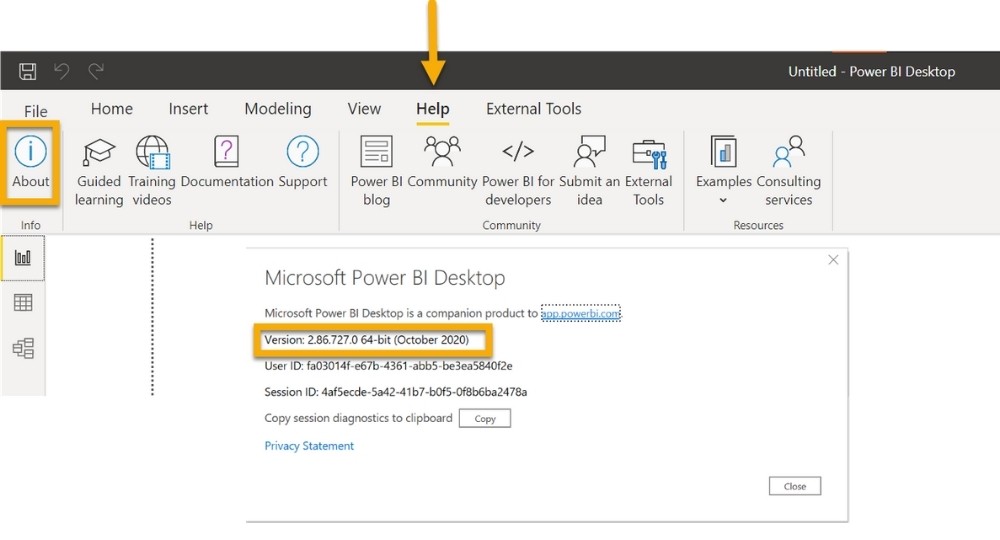
If you are wondering what version of Power BI you are working with, simply click on the Help tab of the ribbon and select About. You’ll get a popup that shows you what version you are working on.
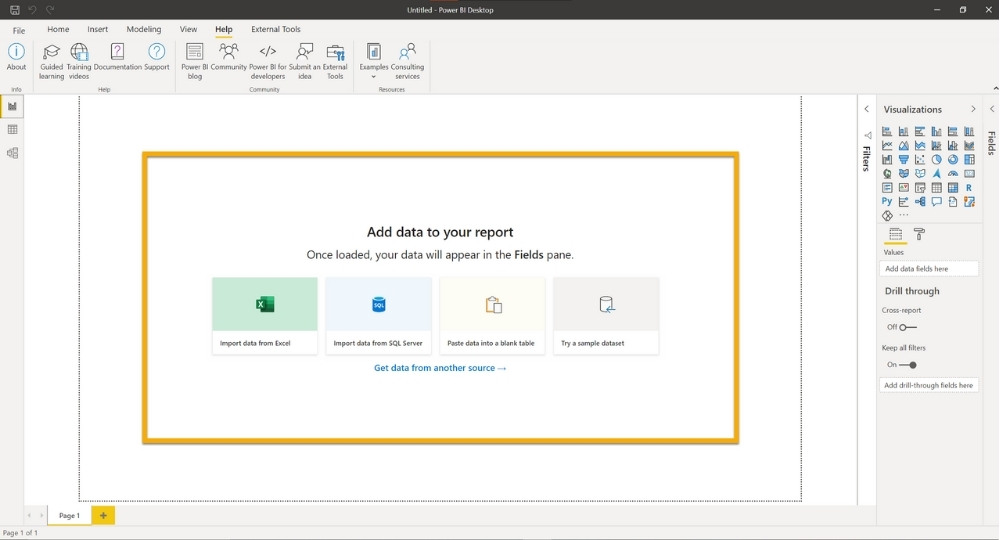
Another easy way to tell is that the October version looks very different from previous versions, in that what you see on the screen is not just a blank canvas! You should see some nice new guidance text and images to help you get started!
2. Select Try a sample dataset and Load data from the popup window
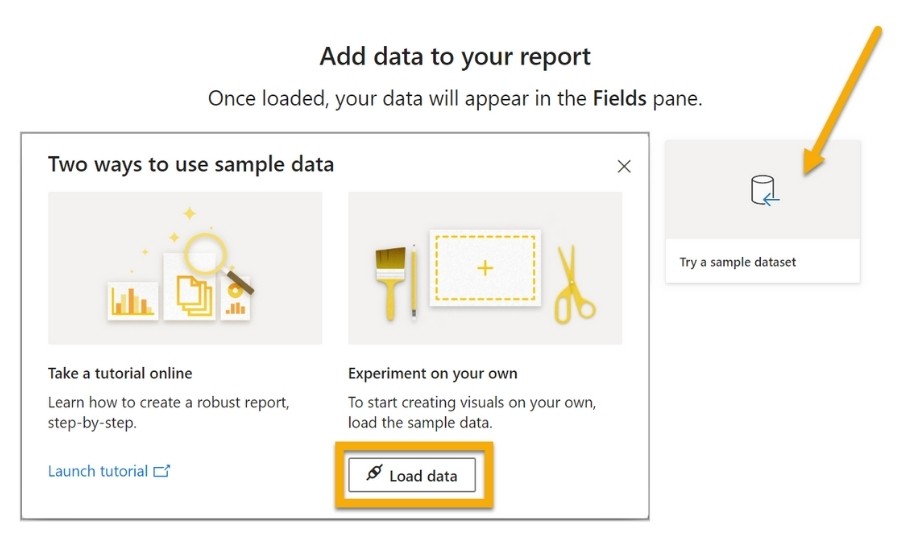
From here you will get a popup window that shows you the contents of the sample data file. This Excel file has one sheet (Sheet 1) containing one table (financials).
3. Select financials by checking the box next to the content, which will show you a preview of the data
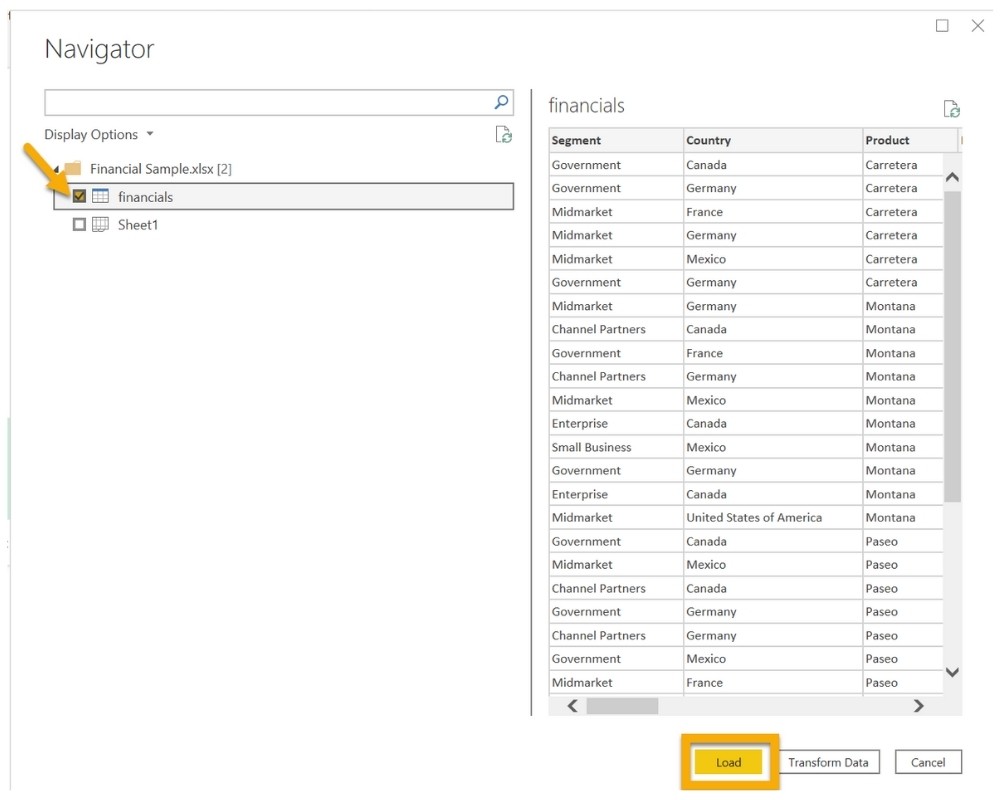
Click on Load to add the data in the financials table to the Power BI data model.
Note that once you become more comfortable with Power BI, you will want to select the Transform Data button, which will open up the Power Query editor and allow you to make transformations to the data. Today, we’re going to work with the data as it appears in the source.
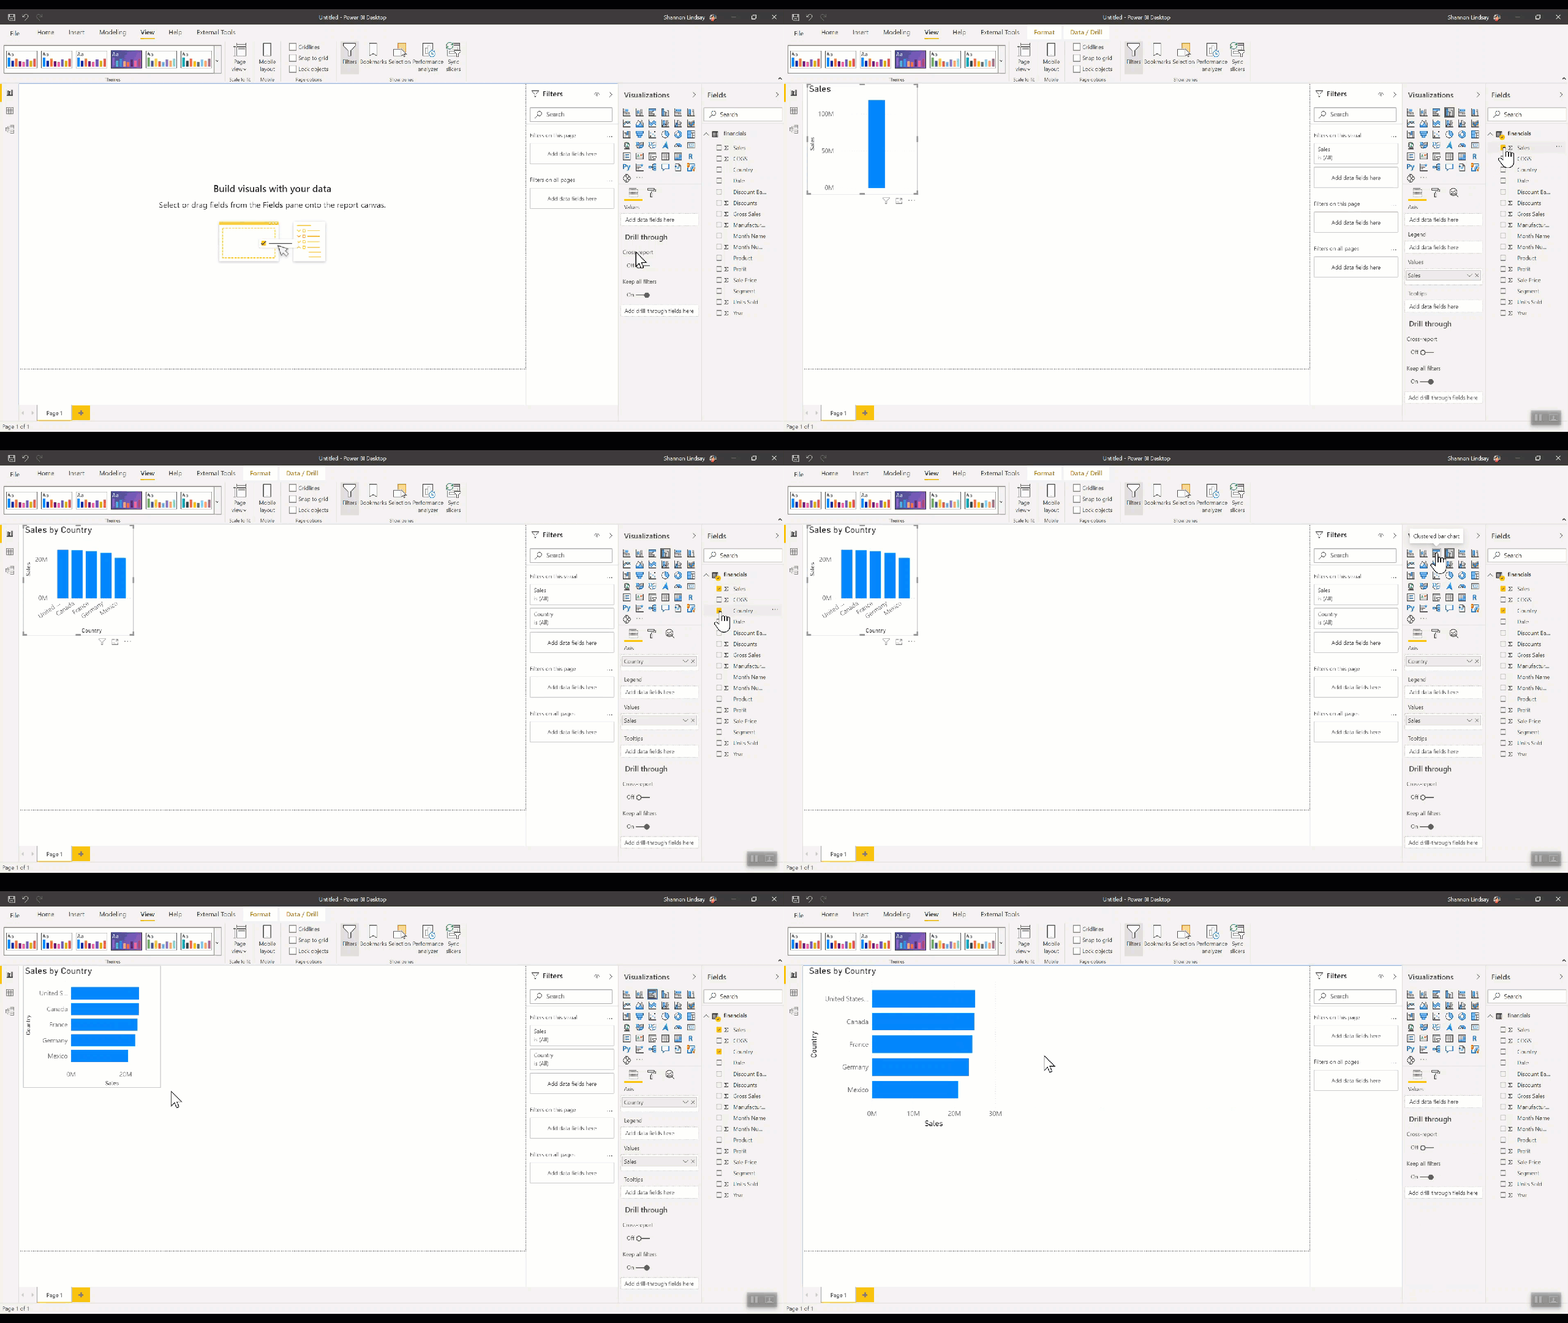
4. Select a field from the fields pane to add data to your canvas. You must ensure that a tick mark appears next to the field.
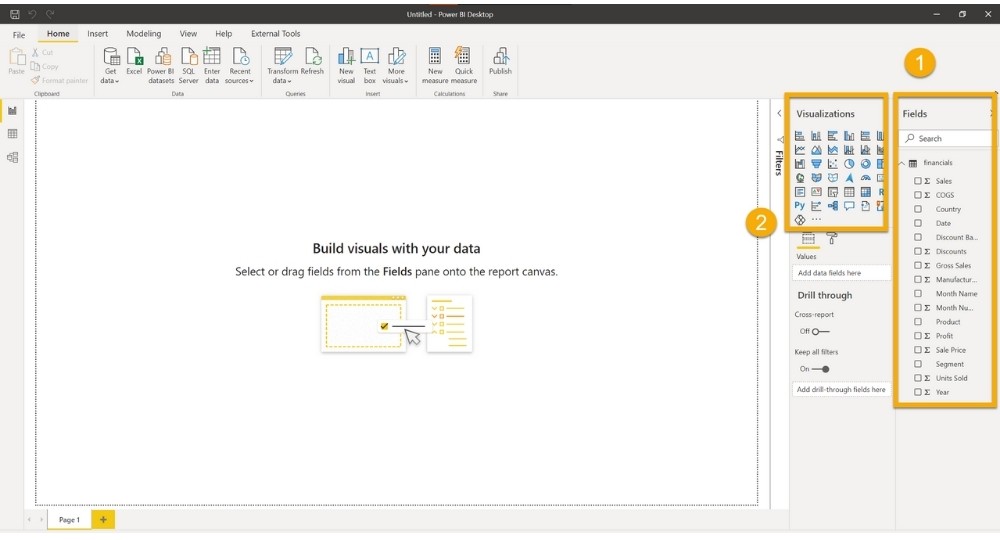
After you have added a field, you can use the Visualizations pane to change the type of visualization you want to display.
You are now on your way to building Power BI reports. With just a few clicks of a button you can present data to decision makers!
For more information on how to use Power BI, browse our curated list of Power BI resources.
Ready to find out more?
Contact us today for a free consultation!
*Power BI Desktop is updated with new features monthly. If you are using Power BI Desktop that you downloaded from the Microsoft Store, your tool will automatically update. Read this helpful blog post for more information.
- Posted in
- Power BI
