Our Work

Blue Raster helps you tell your story through interactive
mapping technology. Make your message clear, exciting,
and user-friendly for both mobile and web platforms.

ArcGIS Image Extension for Server

Blue Raster Pioneering Imagery Management Technology and Delivery Workflows with ArcGIS

Many organizations prioritize the accessibility of imagery and image-derived products for visualization and analysis among both internal and external users. As such, efficient  management and delivery workflows are crucial for these organizations to fully harness the power of spatial data and maximize their product impact. Use cases for aerial images and raster data include land cover classification, urban planning, natural resource management, emergency response and disaster management, precision agriculture and conservation, environmental monitoring and change detection/climate change analysis.

Blue Raster specializes in utilizing the robust capabilities of GIS and cloud services to facilitate the seamless assembly, analysis, management and dissemination of multiresolution imagery, and raster data from different sources and timeframes. Our expertise helps organizations enhance their spatial data management and analysis capabilities.

Employing ArcGIS for Imagery Hosting, Analysis & Management

Empowered by cutting-edge technology, Blue Raster excels in tapping into the full potential of ArcGIS for image hosting, analysis, and delivery workflows across ArcGIS Enterprise, ArcGIS Pro, and ArcGIS Online. With ArcGIS Image Server and ArcGIS Image for ArcGIS Online, we enable organizations to host and conduct dynamic imagery analysis on an unprecedented scale.

The scalability and performance of ArcGIS Image Server redefines the boundaries of what is achievable in geospatial analytics. Additionally, by integrating imagery into the ArcGIS Online platform, organizations can create compelling and informative maps that facilitate a deeper understanding of their spatial data.

Providing On-Demand Imagery Delivery Services

We specialize in providing swift, on-demand collection and smooth delivery of imagery through versatile means including API keys, custom widgets, online user interfaces, and application plugins. Our expertise ensures that you have the necessary tools and support to cater to diverse requirements and preferences.

Whether you need quick access to specific imagery, or a tailored solution embedded within your applications, Blue Raster stands ready to assist, offering a range of flexible and efficient options to meet your unique needs.

Furthermore, we recognize the importance of seamless delivery workflows in ensuring timely access to critical imagery resources. Our solutions are designed to optimize delivery pipelines, minimizing latency and maximizing efficiency. Whether it's delivering imagery to remote field teams or integrating seamlessly with existing systems, we prioritize speed, reliability, and scalability to meet the dynamic needs of our clients.

Our commitment to innovation extends beyond just technology; it's ingrained in our culture. We're constantly exploring new ways to push the boundaries of what's possible, whether it's through advancements in artificial intelligence, cloud computing, or data visualization. By staying at the forefront of technological innovation, we empower our clients to stay ahead of the curve and achieve their objectives with confidence. Our teams of professionals are here to assist you in developing and deploying your delivery workflows.

Pioneering Collaborative Cloud-Based Imagery Management

For over a decade, Blue Raster has been working with clients and partners to deliver large volumes of imagery to support various geospatial workflows. Our cloud specialty has opened new frontiers for collaborative  management. Maximizing the cloud's scalability, organizations can now store, share, and analyze vast amounts of data in real-time. This not only streamlines internal processes but also facilitates effortless collaboration with external stakeholders.

Across the globe, our clients and partners are employing our services to manage and deliver their imagery to support their projects and organizational goals. Here are some examples:

Learn more about our work here

Contact Us

  • This field is for validation purposes and should be left unchanged.


New Features in the LEARN Tool Expand Functionality for Assessing GHG Emissions from Land Use

As the effects of a warming climate become more apparent, it’s increasingly important to consider ways to mitigate the impact of greenhouse gases on the atmosphere. Forests play a key role in the climate crisis, as about a third of human emitted greenhouse gases are sequestered in trees and forests. Analyzing the impact these forests and tress have using land use and land cover change data is a great way for municipalities to get a read on the effects of greenhouse gas emissions in their own communities.

LEARN Tool ScreenShot 6

Blue Raster is pleased to release the new build for the LEARN (Land Emissions and Removals Navigator) Tool. Built in partnership with Local Governments for Sustainability (ICLEI) and the World Resources Institute (WRI), the LEARN Tool allows for community inventorying of the effects of land use change on greenhouse gas emissions. This tool empowers policy makers, local governments, and community members to make informed decisions on environmental and climate policy.  Blue Raster developed the LEARN Tool to address a significant gap in existing carbon accounting methods. Traditionally, previously analyses have focused on measuring their emissions from energy and transportation sectors, while the emissions and removals from land-use change and forestry have been overlooked. However, these land-based emissions and removals are responsible for a significant proportion of the carbon footprint, particularly in rural areas.

LEARN Tool ScreenShot 1

The LEARN Tool simplifies the process of assessing a community's net greenhouse gas balance. Users can quickly select their area of interest by searching for a municipality name or uploading their own shapefile. With intuitive sliders, users can configure their desired land cover and tree canopy data and choose data for forest and land cover change between 2001 and 2019, as well as data for trees outside of forests for the selected time frame. The analysis is generated for the chosen location and time frame, and users can compare their results against other cities and municipalities. The tool provides emission factors, removal factors, and harvested wood products as view factors for the selected comparison area, with the option to download the results as a PDF or CSV file.

The latest version of the LEARN Tool comes packed with new features that improve its functionality. Users now have access to 1m Tree Canopy Data within the Chesapeake Bay Watershed, courtesy of the Chesapeake Bay Program and Chesapeake Conservancy, providing users with valuable insights into how trees and forests impact greenhouse gas inventories. The inventory period configuration screen has also been upgraded with new toggle widgets, offering users greater flexibility in selecting between 30m and 1m data in their analyses. These new features enhance the user experience and expand the tool's capabilities, making it even more valuable for communities looking to reduce their carbon footprint.

Blue Raster is excited to roll out this tool in its final form to benefit communities across the country.


Software used: ArcGIS Enterprise, ArcGIS Image Server, Esri JavaScript API

Esri ArcGIS Cloud Specialty: Elevating our clients’ GIS capabilities to the sky

Blue Raster is thrilled to be a member of the Esri ArcGIS Cloud Services Specialty. This specialty designates Blue Raster as an expert in deploying and managing ArcGIS in cloud environments such as Amazon Web Services (AWS) and Microsoft Azure. The Cloud Specialty program is designed to help Esri connect customers with recognized Partners that can best provide ArcGIS cloud solutions. Partners that meet the criteria for this specialty must demonstrate a track record of delivering value to their customers in implementing, managing, and designing cloud infrastructure in the Esri ArcGIS environment.  

Esri Cloud Services Specialty

To attain this specialty, Esri assessed Blue Raster’s expertise in the following areas of ArcGIS Cloud services: cloud deployments, system architecture and design, migrations, and managed services. Our deployments of ArcGIS Enterprise in the cloud include routine monitoring and maintenance to allow us to fine tune the system as needed, ensuring reliability and performance. Our system architecture and design experience encompasses single machine and multi machine architectures in both AWS and Azure that are customized to our clients’ specifications. We support all types of migrations including on-premises to cloud provider migrations, ArcGIS Online to ArcGIS Enterprise, and integration with third party providers.

Our portfolio of managed services includes the utilization of a wealth of Esri products and tools in the ArcGIS family such as ArcGIS Enterprise, Data Store, GIS Server, GeoAnalytics Server, GeoEvent Server, Notebooks, Image Server, Pro, Monitor, and Enterprise Geodatabases. Implementing these tools empowers us to provide a number of managed cloud services to our clients including design consultation, server construction, Esri software installation, infrastructure troubleshooting, distributed systems configuration, geographic redundancy configuration, OS patching, Esri security patching, routine Esri patch deployment, DevOps services, and user training services, among others. Blue Raster is primed and ready to meet our clients’ needs in all areas of the Esri ArcGIS cloud.

ArcGIS Cloud Solutions by Blue Raster

With over 10 years of experience providing ArcGIS Cloud consulting services, Blue Raster is proud to be a trusted resource for a variety of cloud solutions, including: 

    • Cloud ArcGIS Enterprise implementation 
    • Data migration 
    • System architecture and design 
    • Enterprise migration 
    • Security 

We use our cloud expertise to assist a variety of clients with a range of projects. Our dedicated DevOps team supports our cloud projects from requirements gathering through completion. Keep checking our blog posts for our latest projects as we continually grow and evolve our cloud-based service offerings.  

Are you looking to expand your ArcGIS capabilities in the cloud?
Contact us today to learn more about how we can help!

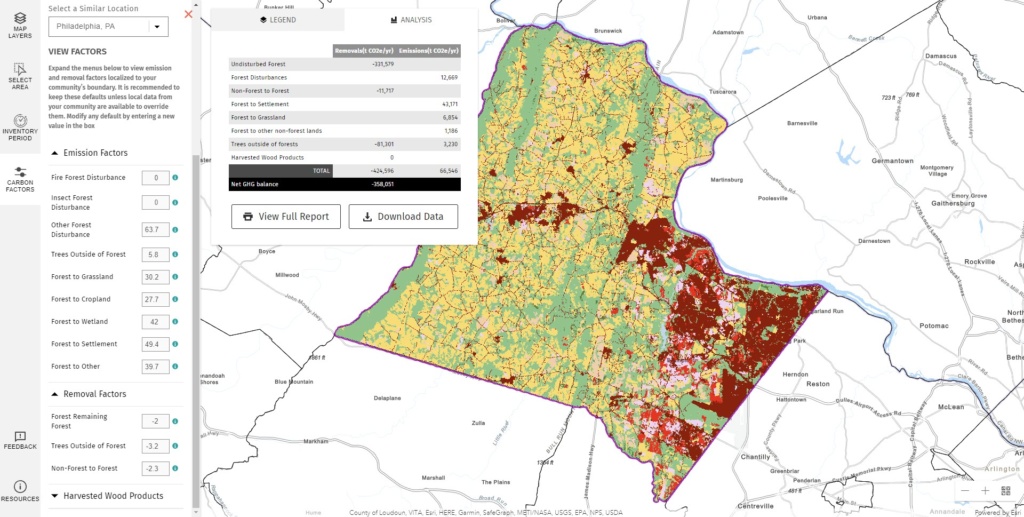
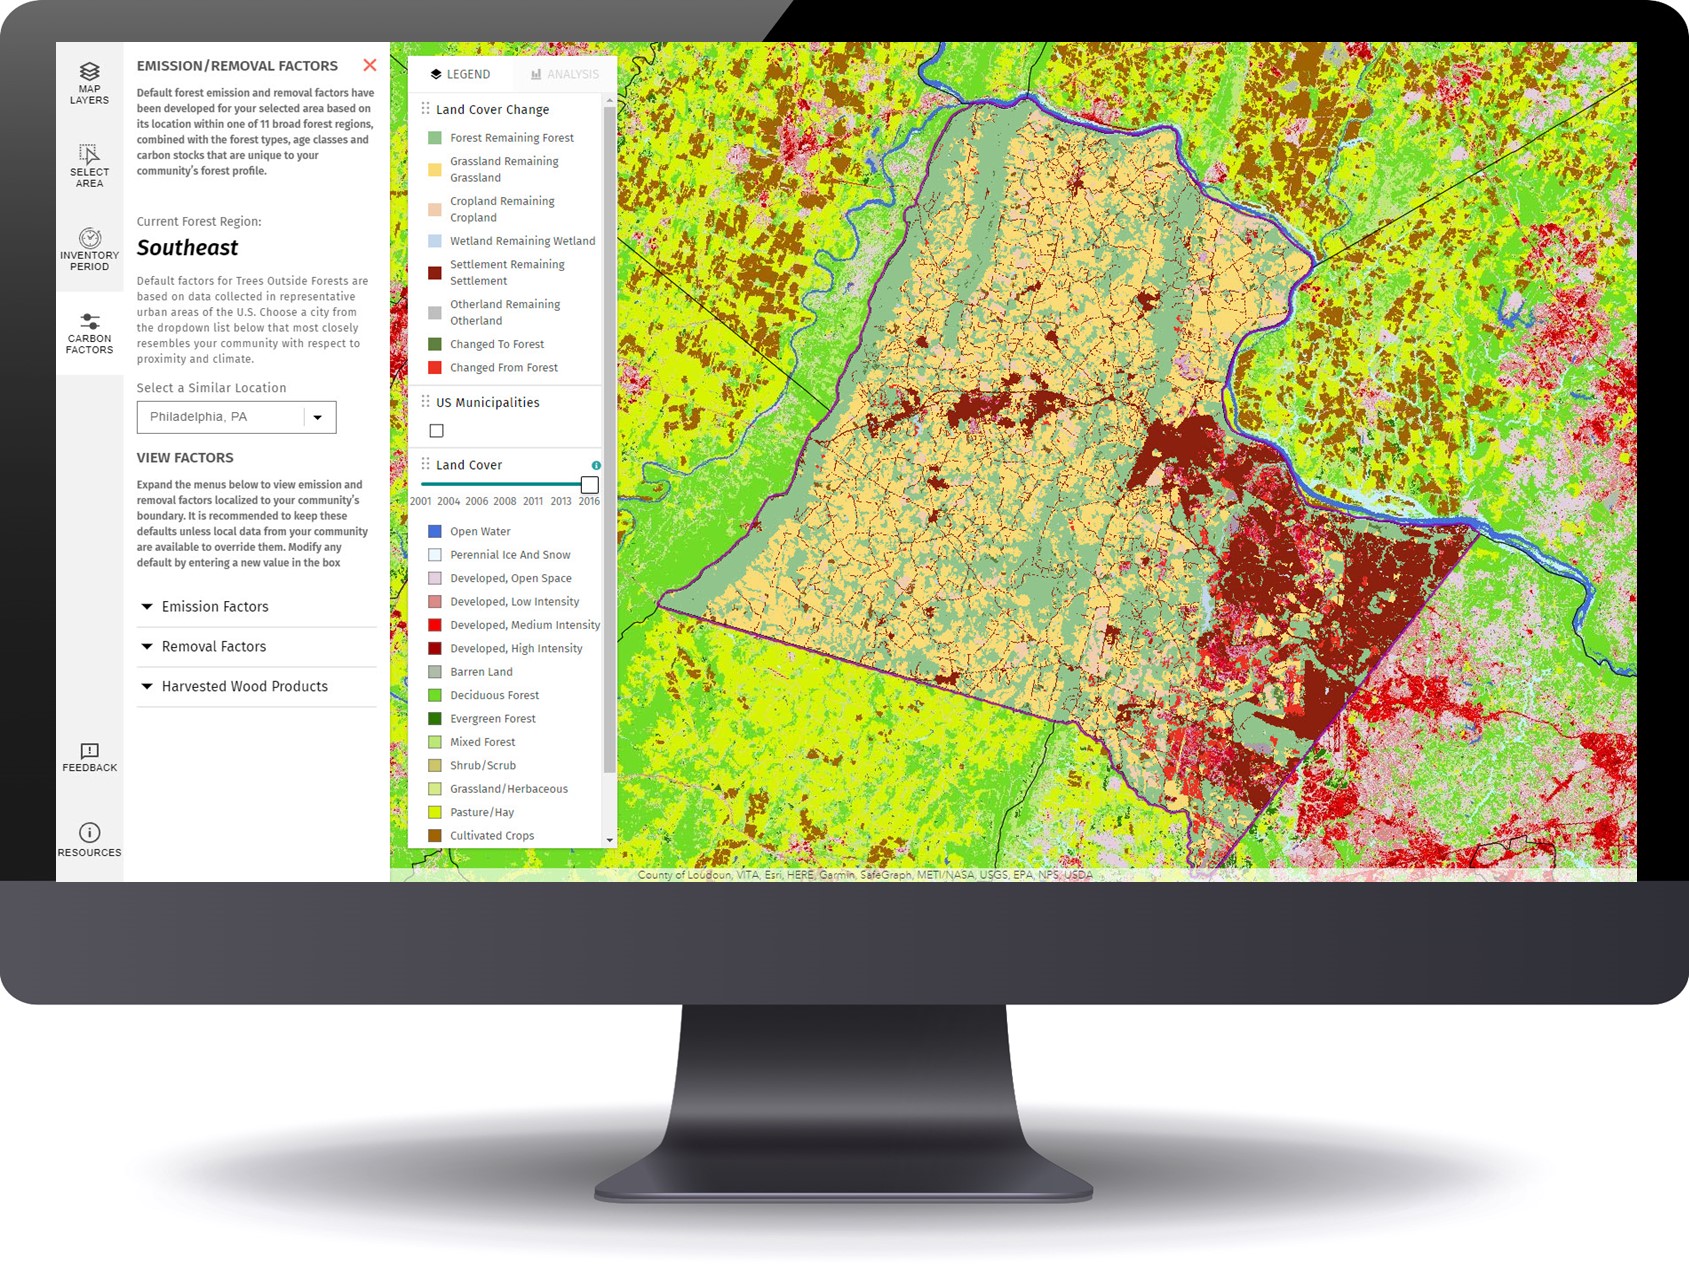
Estimating Community GHG Emissions from Land Use Change

As communities around the United States seek to mitigate the impact of climate change by reducing their greenhouse gas (GHG) emissions, the importance of land use to the GHG balance has become more apparent. About one third of human caused GHG emissions each year are sequestered in forests and trees but most communities do not include forests and trees in their inventories. To help fill this gap, the World Resources Institute (WRI) and Local Governments for Sustainability (ICLEI) developed the Land Emissions and Removals Navigator (LEARN) tool.

GHS emissions imagery

The LEARN tool provides an intuitive step-by-step workflow for communities to assess their net GHG balance based on land-use and land-cover changes. Once users have selected or uploaded their municipal boundaries and inventory period, the tool calculates land cover change using National Land Cover Database (NLCD) data. Users can then explore a change image to quickly see where areas are being converted to and from forests.

As the characteristics of the forests within the municipality impacts the amount of carbon emitted or removed, the change image is then compared to a carbon stock map developed from US Forest Service data based on the age and type of forest. NLCD tree canopy data is also used to identify addition or removal of trees-outside of forests to ensure a comprehensive assessment. Forest disturbance data for insects, fires, and other disturbances are also incorporated into the GHG balance. Finally, users can input the value of GHG removals from Harvested Wood Products (HWP) within the inventory period as HWP continue to sequester carbon.

Once the user has gone through the four simple steps to complete the audit, they are presented with an easy-to-understand table showing their community’s Net GHG Balance and the source of the emissions and removals. A PDF report and CSV data are also available to provide detailed analysis of the land-use and land-cover change with charts and graphs as well as the carbon factors for emissions and removals used.

The LEARN Tool was developed using the Esri JavaScript API and ArcGIS Image Server to provide the analysis.

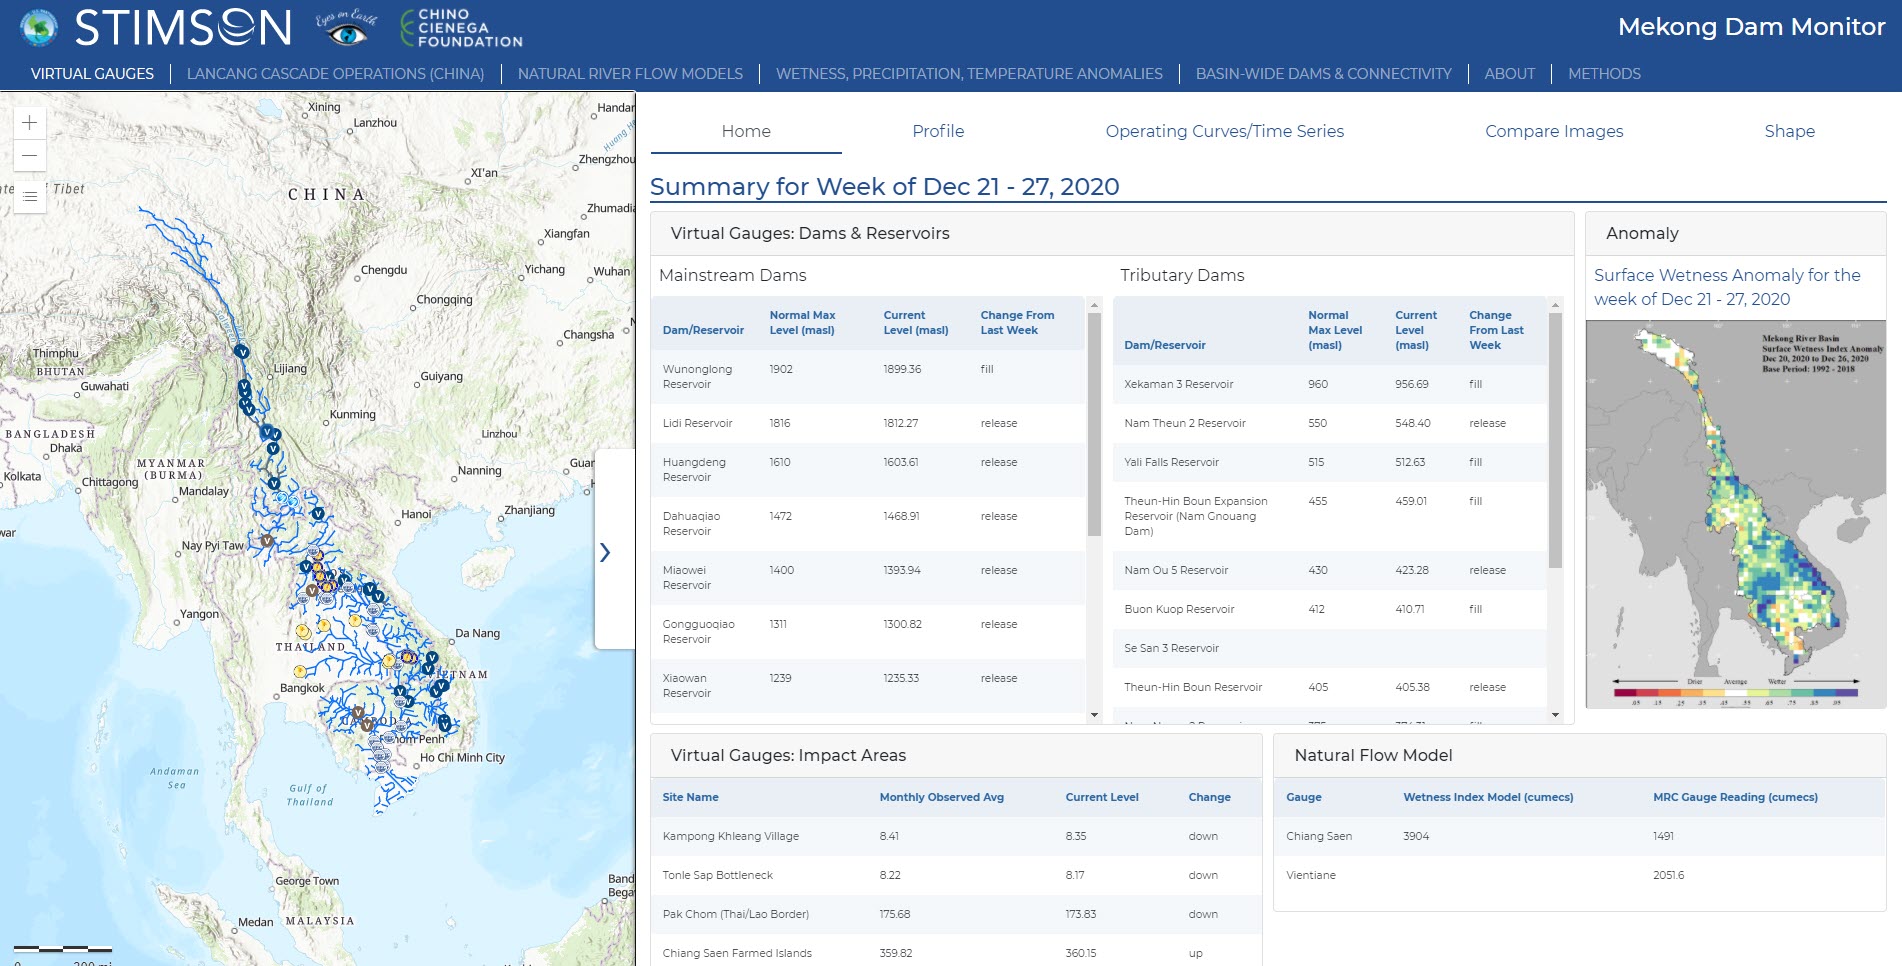
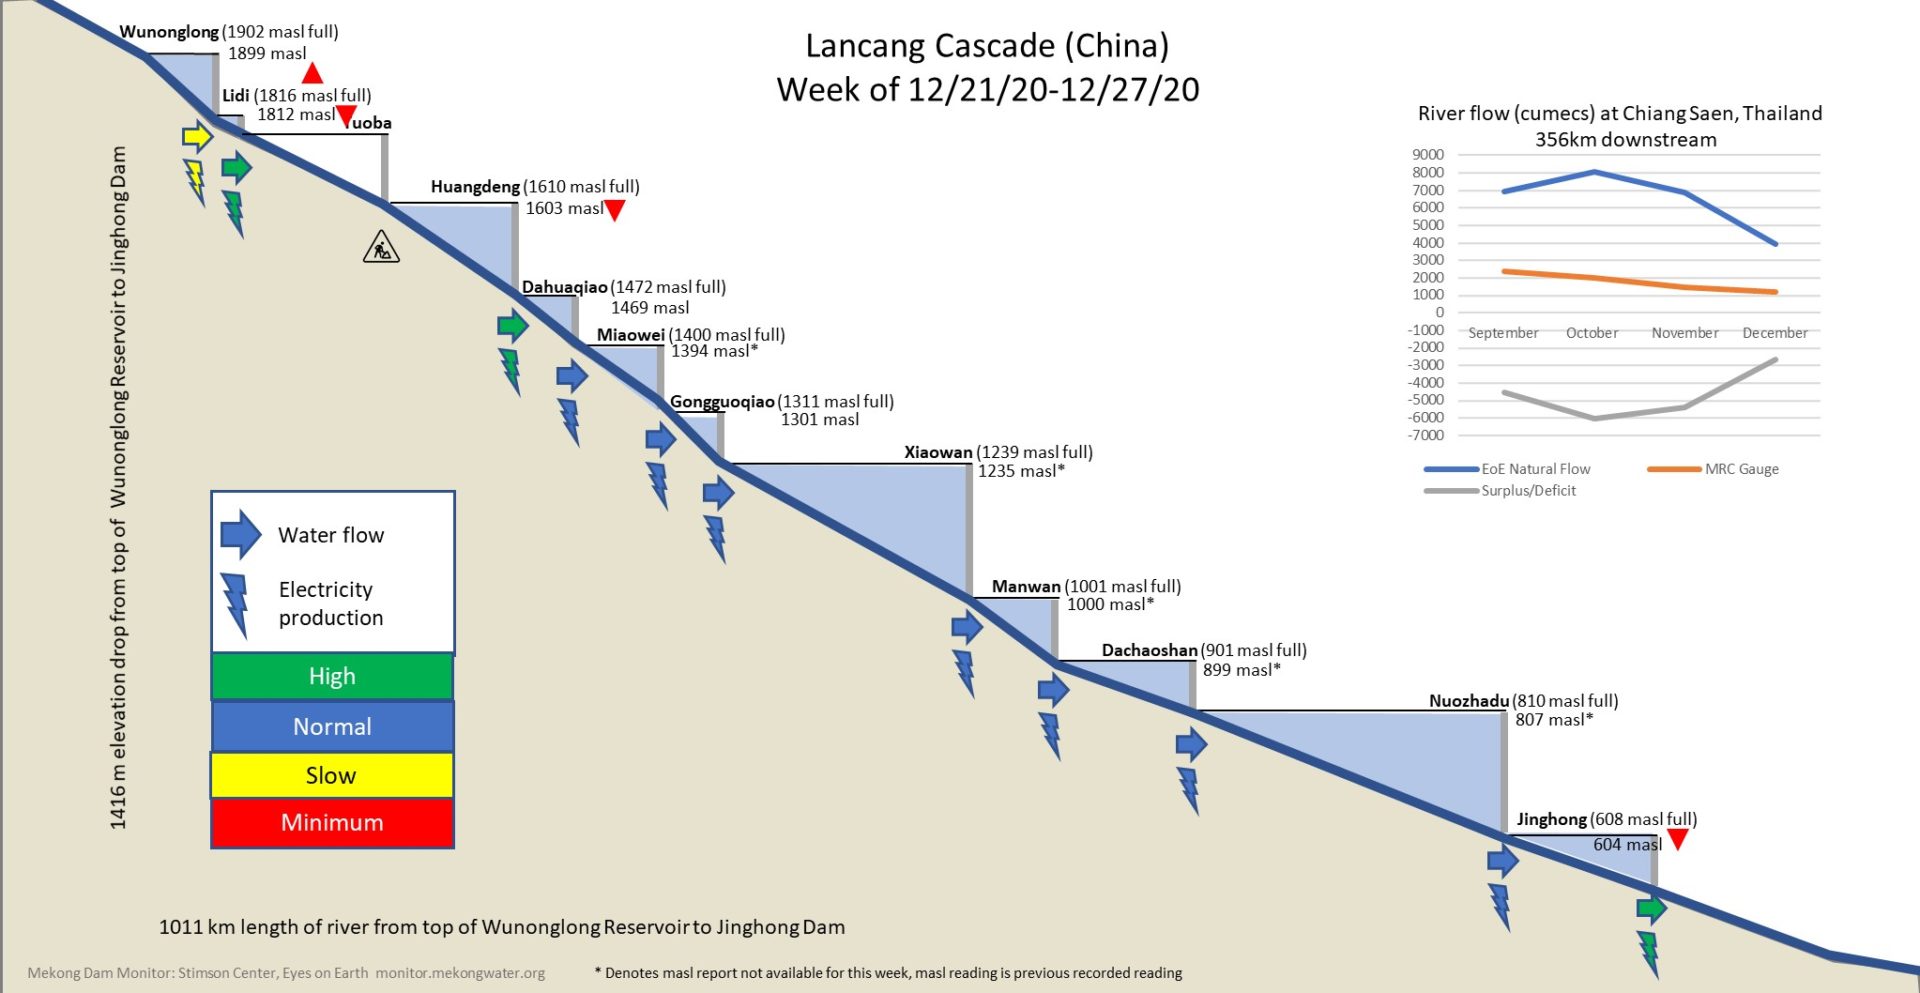
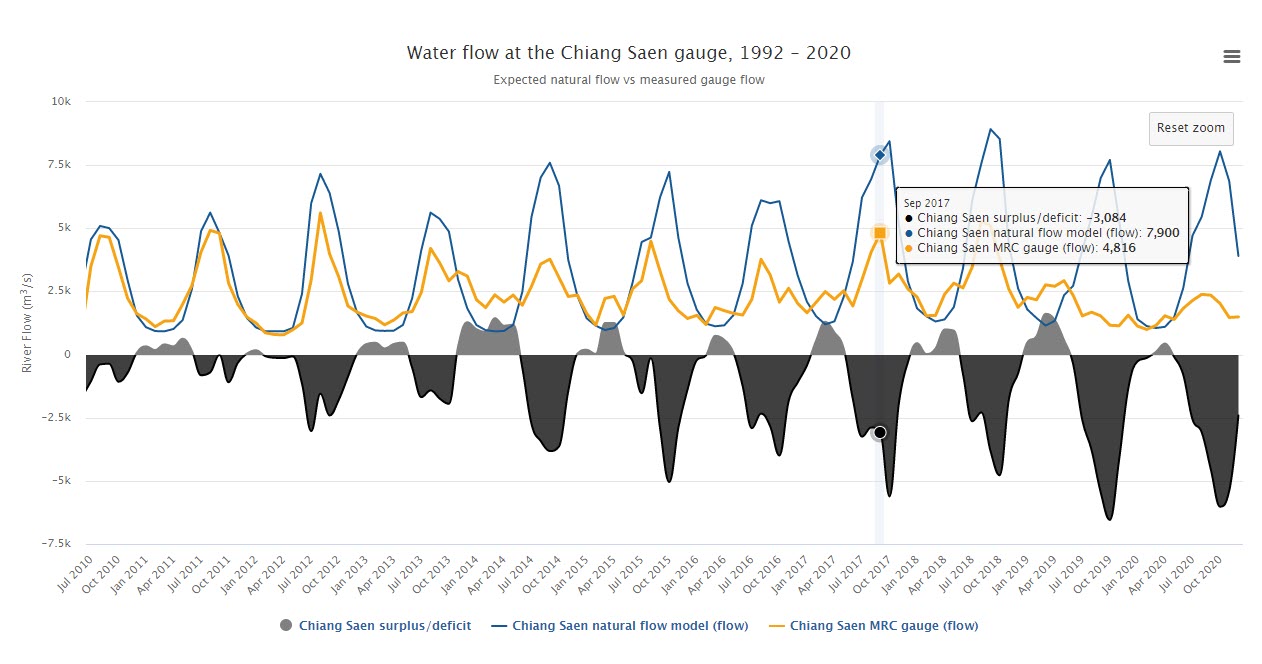
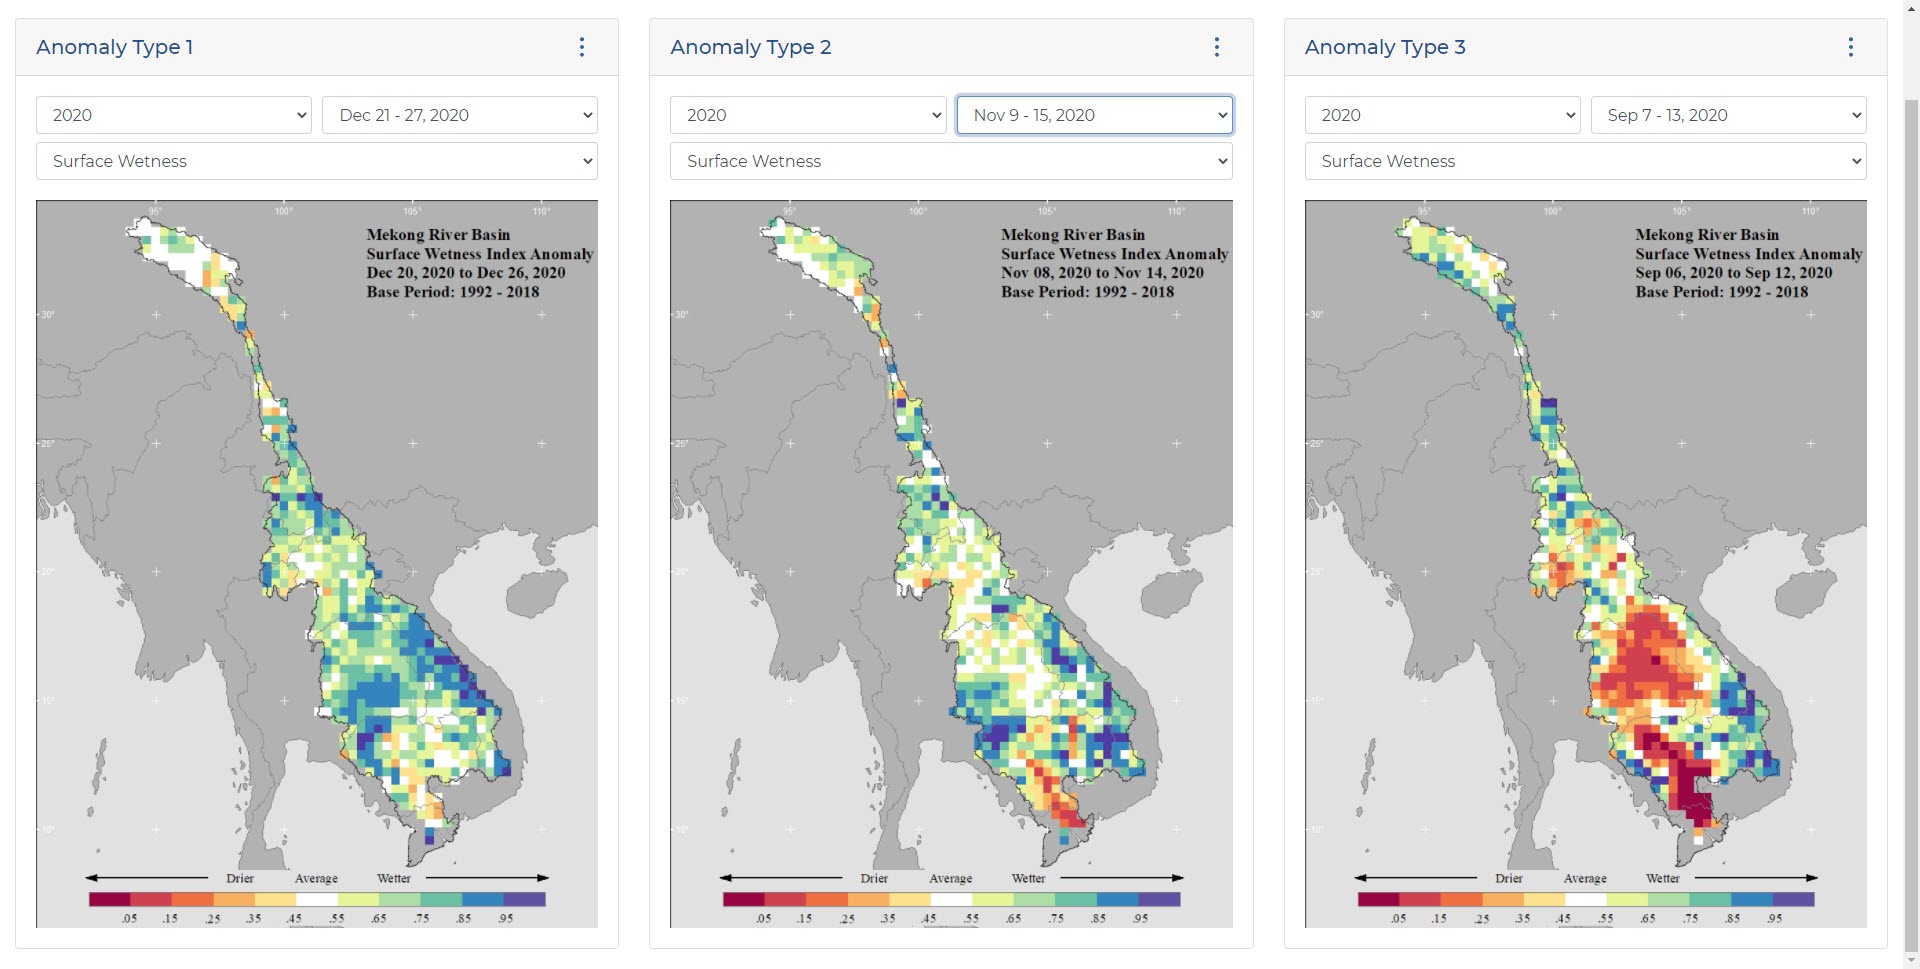
Bringing Transparency to Transboundary Water Policy in the Mekong River Basin

From its headwaters on the Tibetan Plateau, the Mekong River runs through six countries, China, Myanmar, Laos, Thailand, and Cambodia before reaching the ocean. Over 60 million people live in the Mekong watershed and rely on its natural resources and fish and agricultural products produced here are shipped throughout the world. However, recent evidence indicates that the operation of new upstream dams constructed in China are changing the natural flow cycle of the river, affecting downstream communities.

mekong dam monitor

In spring 2020 a U.S. State Department-supported study by independent researchers at Eyes on Earth published a study showing that the upstream dams restricted enormous quantities of water in 2019, while downstream areas were experiencing an unprecedented drought. The newly launched Mekong Dam Monitor builds on that research to provide unprecedented transparency of the flow of water and conditions of dams and reservoirs along the Mekong River. The application was developed through a partnership between the Stimson Center’s Southeast Asia Program and Eyes on Earth, Inc with funding from the Mekong-US Partnership, and the Chino Cienega Foundation.

The Monitor includes multiple tools and indicators in a single platform, giving a comprehensive near-real time view of the current state of the Mekong basin along with historic conditions. Users can explore detailed information about dozens of dams and Impact Areas, including viewing satellite imagery, weekly reservoir level (meters above sea level), and inundated area, all estimated from remotely sensed data in the Virtual Gauges page. One tab over, the Lancang Cascade visualization shows the weekly state of water retention and power generation in each of China’s 11 upstream dam cascade. Just two dams in the cascade, Xiaowan and Nuozhadu can collectively hold nearly as much water as the Chesapeake Bay.

The Natural Flow Model visualizations leverage analysis by Eyes on Earth that predict the expected water in the Mekong River based on temperature and precipitation data derived from satellite imagery. These values are compared to actual flow rates measured at two locations by the Mekong Water Commission. The expected and measured flow rates diverge starting in 2012 with extreme differences in 2019 and 2020 when very little of the expected water from the rainy season passed the downstream gauges.

Additional data on climate anomalies, such as precipitation, snow cover, and temperature allow users to compare current and historic maps from 1992 to the present. Finally, the Basin Wide Dams and Connectivity page builds on the success of the Stimson Center’s Mekong Infrastructure Tracker Dashboard and provides comprehensive information about hydropower development in the region. This includes information about dam developers, financers, energy generation, and more.

mekong river basin

The Mekong Dam Monitor was developed using the Esri JavaScript API and leverages data hosted in ArcGIS Online as well as ArcGIS Image Server.

Nearly all data shown in the Monitor is available for download for transparency. With this tool, stakeholders and policy makers will have a greater ability to anticipate environmental and social impacts of dam operations, adopt evidence-based policies for managing the Mekong River, and participate in transboundary river governance.


Page 1 of 3