Development

New Era for Plant Mapping at New York Botanical Garden with PlantTracker

New York Botanical Gardens Plant Tracker App displayed in a laptop and iPhone.

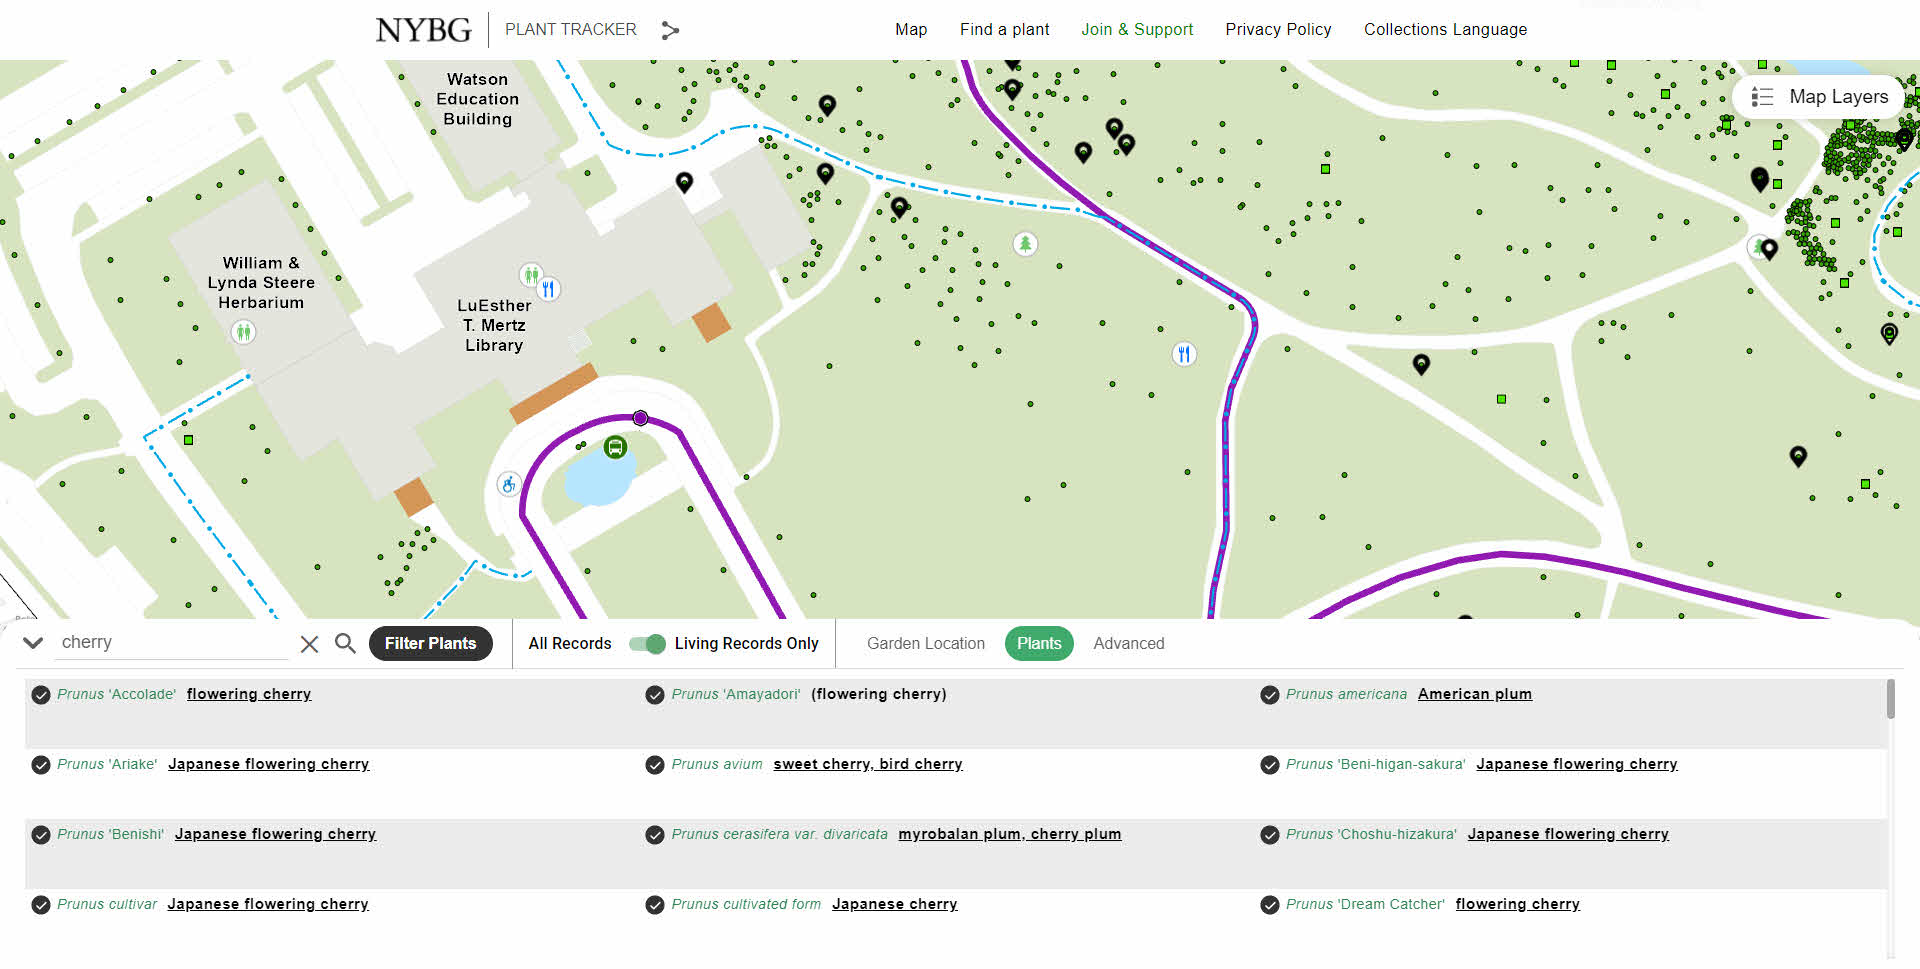
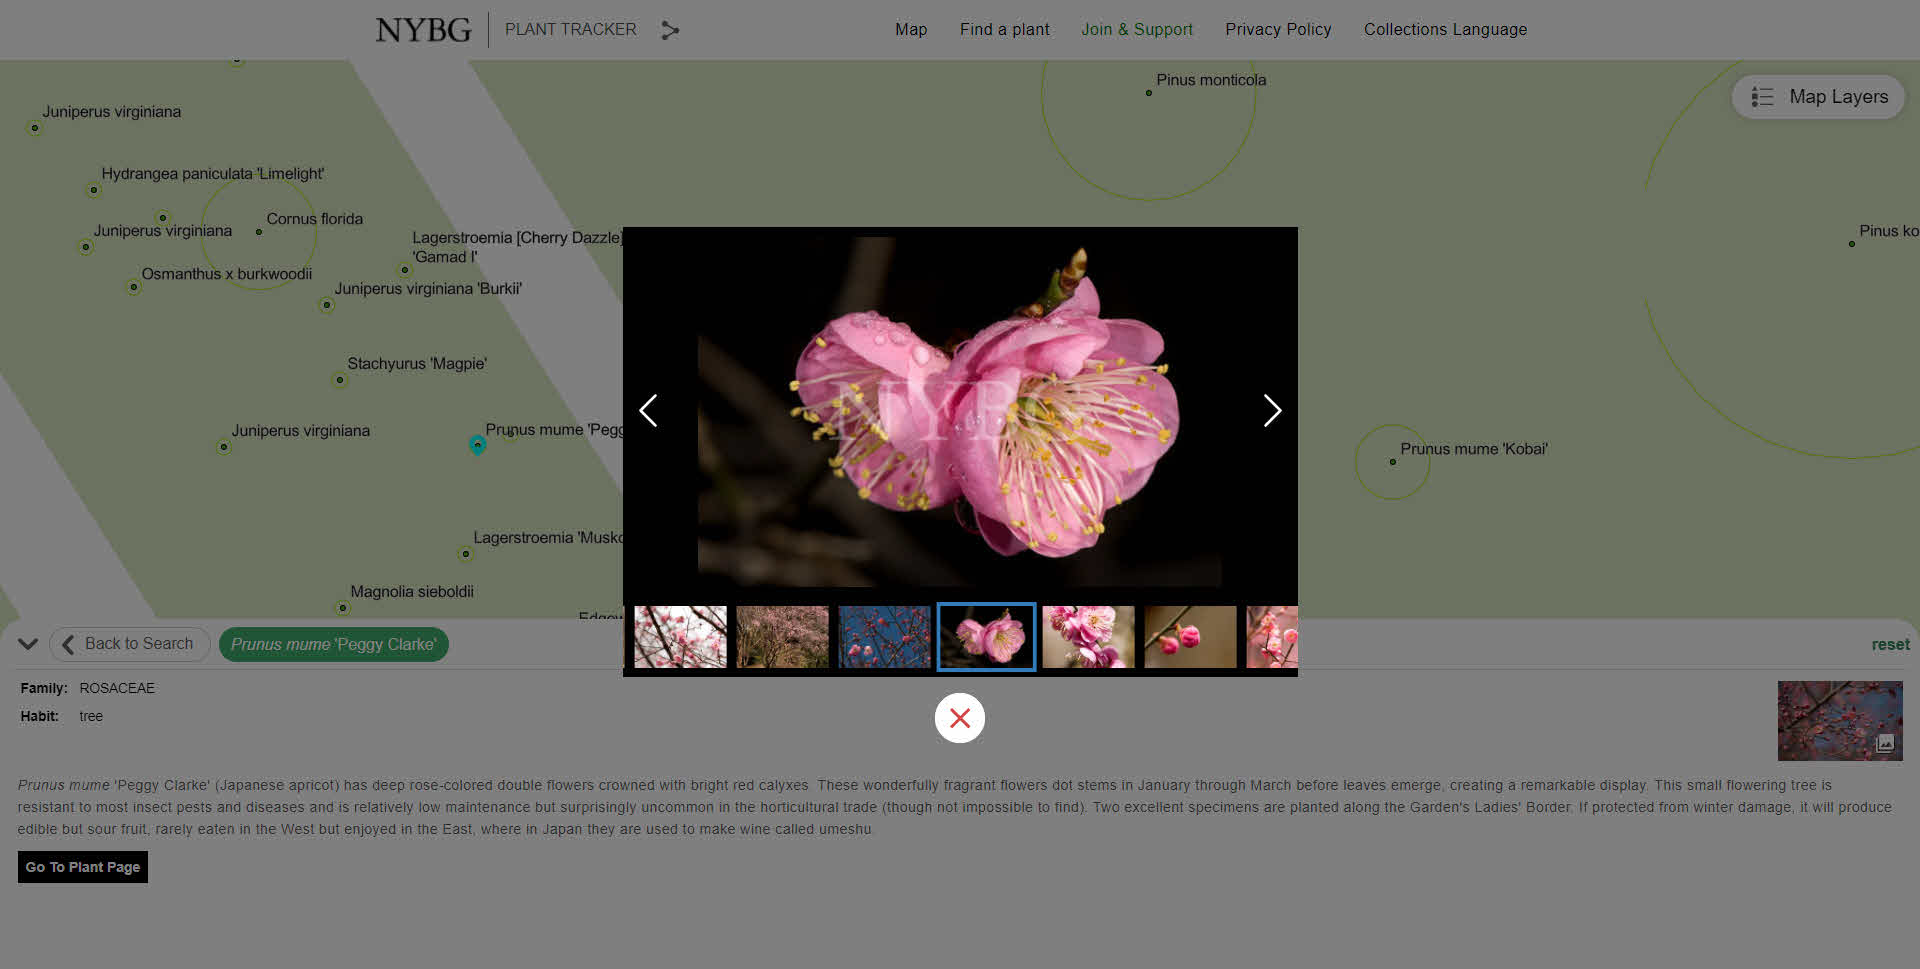
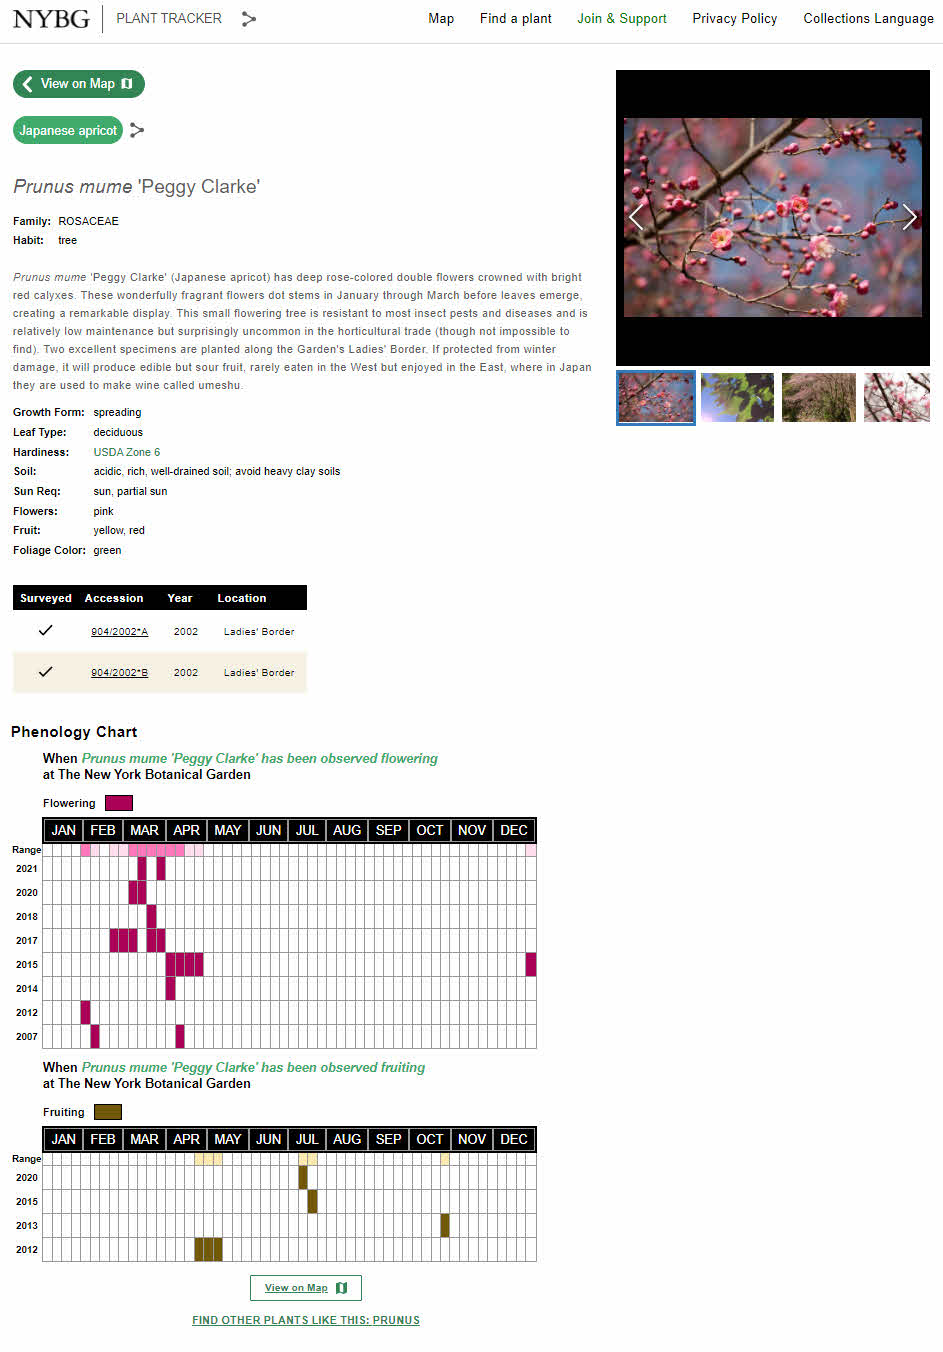
Established in 1891 and covering 250 acres in the Bronx, New York Botanical Garden is the largest urban public garden in the United States. With the beauty of the collections, landscapes, and gardens it's no wonder why over one million people visit the garden annually. Looking to upgrade their public mapping presence and expand internal use of GIS, NYBG and Blue Raster partnered to develop PlantTracker. Replacing a previous tool, PlantTracker is the online catalog of NYBG's living collections used to find plants, navigate the grounds, get plant information, view photographs, and take curated tours. 

NYBG Plant Tracker App displayed on an iPhone

PlantTracker aides the public onsite and from home and also daily workflows of NYBG staff and the institutions educational programs rely on the tool. Funded through an IMLS Grant, PlantTracker replaces the legacy Garden Navigator application and provides an enhanced user experience with a map-centric and mobile-first design.

Blue Raster first deigned a GIS architecture environment and installed and configured ArcGIS Enterprise. Next, Blue Raster had to create many spatial datasets for use in GIS by converting existing CAD files and tables. This included working with exports of plants managed through BG-Base, totaling over 143,000 living and historical records. The GIS Team at Blue Raster improved the spatial accuracy of almost 700 location codes used for mapping and outlining the main garden locations. Plant photo workflows were also upgraded by integrating with the Asset Bank API.

In addition to PlantTracker, GIS upgrades allowed the opportunity to integrate Esri mobile workflows for staff. Configuration with ArcGIS Field Maps and Workforce for ArcGIS expands plant mapping workflows, allowing workers to update existing location, condition and measurement data in the field. Blue Raster works closely with BG-Base to sync both systems through a series of Python scripts that run nightly and as often as every five minutes. This means NYBG can continue to use BG-Base as the system-of-record for their collections, but take full advantage of GIS for mapping applications and field workflows.

NYBG has embraced GIS in a big way. In short time, a lot has been done to improve public and staff workflows around mapping. Explore NYBG PlantTracker to see for yourself!

NYBG Tour
NYBG Gallery
NYBG Details
planttracker

Learn more about Blue Raster's work with public gardens, cemeteries, and arboretums here.

Contact us today!

Manassas Park Deploys ArcGIS Tools to
Modernize IT Infrastructure

Small City + Big Data = Time to Modernize IT

Manassas Park is an independent jurisdiction in Northern Virginia, approximately 30 miles southwest of Washington, DC. The city borders Prince William County and the City of Manassas. It is primarily residential in nature within close proximity to interstate and railway transportation into the heart of the Greater Metropolitan Washington DC area. modernize IT

The city had an aging, homegrown solution for their GIS data and wanted to modernize the system so that it would meet the current and future needs of City operations including tax assessment, public works, emergency response, parks and recreation, and zoning to name a few. Being a small city with an even smaller staff, the system needed to be easy to use and maintain for a team that did not include GIS professionals. 

Creating a Town Square for Data

Blue Raster implemented Esri tools, including ArcGIS Online, Experience Builder, and ArcGIS Dashboards, to aggregate all data into a single cloud-enabled solution. Doing so meant users across city operations had access to data that could inform them of their planning and day-to-day operations. 

  • Economic Dashboards show tax assessment growth over time as well as show revenue generated from meals tax and business licensees by neighborhood.  
  • The parks department now has a single view into their multiple data sources. They can now access and view membership for the city-run waterpark, visitor numbers for that waterpark, and community center reservations in a single application. 
  • The police can now overlay data from multiple ticketing systems (parking, civil disturbance, and traffic) to get a holistic view of where violations are happening.  
  • Fire and rescue can now see 911 data to get a sense of any patterns in where and when calls come in.  
Manassas Park screenshot
Manassas Park Dashboard to modernize IT

First Step Toward Cloud

The city manager is using this GIS project as a pilot to show what can be done when the City utilizes the power of cloud technology. Pointing to the success of these applications, he hopes to gain buy in and funding for modernizing other areas of the City’s IT infrastructure to a cloud-based system.  

Read the Esri case study about the use of ArcGIS Velocity in Manassas Park:

Law Enforcement in Manassas Park, Virginia, Tracks Vehicles and Calls for Service with Real-Time Data Solution

Ready to find out more?

Contact us to learn how we can help you modernize your data and IT infrastructure to help make critical decisions about public safety, recreation, economic investments, and more. Read about we helped other state, county, and city organizations with their efforts to modernize IT.

Track Industrial Spaces in the Mekong Region with the Updated Mekong Infrastructure Tracker

The Mekong Policy Project aims to address the regional environmental and social impacts along the Mekong River to improve food security, stability and cross-country relations.

Launched earlier this year, The Stimson Center's Mekong Infrastructure Tracker offers unprecedented transparency into the financing and development of roads, rails, waterways, and power generation projects in the Mekong region. Funded by USAID and supported by The Asia Foundation, the tool allows users to search and filter for projects by type, operational status, funders, and more.

Mekong Infrastructure Tracker Updates

Now, with the latest release, the Tracker includes data on Industrial Spaces. In addition to major transportation hubs, such as railway stations, airports, and seaports, these include special economic zones, cross border economic zones, and industrial zones. These areas, with special tax treatment and other regulations, are key centers of economic activity and international investment.

mekong infrastructure tracker Industrial Spaces

"The Tracker's new industrial spaces dataset provides for the first time a visualization of 700+ completed and planned industrial zones, special economic zones, airports, train stations, and seaports in the Mekong region. We think the private sector, government stakeholders, and NGOs will find particular interest in viewing this data. When viewing the data on the Project Impact Screener, the connectivity of the region really come forward because these industrial spaces can be framed together with a comprehensive set of transportation routes and power generation assets."  -  Brian Eyler, Senior Fellow and Director at The Stimson Center

mekong infrastructure tracker Stimson Industrial Spaces 1

Leveraging ArcGIS Online and the ESRI JavaScript API, The Mekong Infrastructure Tracker builds on existing data to present a comprehensive source of information on energy, transportation, and water infrastructure in the Mekong countries. Additionally, there is an ArcGIS Survey123 link that allows users to submit more project data or provide updates to existing data.

The Mekong Infrastructure Tracker platform is the premier resource for researchers to track, monitor, and quantify the development of energy, transportation, and water infrastructure assets and the social, economic, and ecological changes they bring to South East Asia.

Mekong Infrastructure Tracker

Home to more than 300 million people and some of the most endangered wildlife on the planet, the Greater Mekong region in Southeast Asia is the second most naturally diverse place in the world, second only to the Amazon. This region is also home to the Mekong River which not only sustains much of the wildlife in the area, but also the people. The majority of the population in this region is dependent on the river and its surrounding wetlands to support their way of life. In turn this also means that this population and the vast biodiversity in the region are extremely vulnerable to the economic and environmental outcomes of growing infrastructure.

Mekong River

As one of the nation’s leading think tanks dedicated to building solutions to promote international security, prosperity, and justice, the Stimson Center is working to address the environmental and social impacts along the Mekong river to improve food security, stability and cross-country relations. To help analyze these issues, Blue Raster collaborated with the Stimson Center to create The Mekong Infrastructure Tracker, an interactive Web App to explore the infrastructure boom and its impacts in the Mekong region. With funding provided by USAID, the Mekong Infrastructure Tracker was developed with support from the USAID Mekong Safeguards activity led by The Asia Foundation.

Mekong Infrastructure Tracker

The Mekong Infrastructure Tracker

The Mekong Infrastructure Tracker web app leverages ArcGIS Online and the ESRI JavaScript API and provides users with data transparency to analyze the type and scale of different infrastructure projects in the region in relation to socioeconomic and environmental factors.

The tracker contains two dashboards, one showing power generation projects and the other showing road, rail, and waterway infrastructure projects. The data in the tracker visualizes projects by type in combination with data showing threatened species, earthquakes over the last twenty years, armed conflict, ethnicity, watersheds and tributaries that can all be turned on and off depending on user preference.

Additionally, users can filter the projects by a variety of statuses: year of completion, project size, sponsoring country, project type, country, or watershed.

Mekong Infrastructure Tracker filter

From these filters, the tracker produces a series of charts and graphs to better visualize some of the statistics surrounding these projects which can then be downloaded based on user needs.

The Mekong Infrastructure Tracker allows for transparency of the infrastructural impact on this region, both protecting the diverse and endangered wildlife as well as the livelihoods of millions of people. Explore this new tool today!

ArcGIS Maps for Microsoft Power BI: Make Spatially Informed Business Decisions

What is Microsoft Power BI?

Power BI is an award-winning business intelligence tool created by Microsoft as a single hub for tracking and managing many diverse assets within a given organization. The Power BI platform consists of widget-based analytical tiles from both Microsoft and their various partners. These tiles allow for a simple, professional, and customizable visualization of otherwise unmanageable amounts of business data. The straightforward user interface and intelligent feature construction means that dashboard setup and asset management is now faster and easier than ever before.

Let Blue Raster create and optimize custom maps in Microsoft Power BI to give you more control over your data than ever before.

snip_1

ArcGIS Maps Integration

ArcGIS Maps within Microsoft Power BI contains many map-building elements that are similar to those found in other Esri products, such as ArcGIS Pro and ArcGIS Online. The configuration tab is highly user-friendly, featuring “drag & drop” field population and automatic detection of spatial data types. ArcGIS Maps for Power BI accepts both point and polygon data types. It can recognize fields that contain standard administrative boundaries (such as zip codes, counties, states, etc). Automated geocoding of point locations and polygon centroid calculation help to reduce the time and effort of spatial data management.

snip_3

ArcGIS Maps for Microsoft Power BI provides basemaps and reference layers that are crucial to understanding the spatial context of business data. There are numerous basemaps to choose from to ensure a visualization that complements the symbology of spatially referenced assets. Changing the color schemes of data is also easy to do, with many hand-picked combinations and editable classification settings. Meanwhile, reference layers containing verified spatial data such as Median Household Income or Biodiversity Hotspots are great for showing the underlying geographic or demographic characteristics at any scale. Simple infographics cards display summaries of multiple key factors based on the extent of the map viewer.

The functionality of ArcGIS Maps for Microsoft Power BI also extends to light spatial analysis in the form identifying geographic patterns and relationships. Heat maps and clustering functions allow for the aggregation of data into overarching groups and regions, while location pins and drive time analysis help to evaluate smaller localities around individual assets. The maps editor even features support for temporal animation with a field that transfers time data into a dynamic map sequence.

Understanding the Geography of Business

Large companies with numerous clients, facilities, and/or assets often receive vast amounts of spatial data that go completely unused. ArcGIS Maps for Microsoft Power BI allows companies to harness the true potential of asset location in order to improve their business revenue and productivity.

snip_2

This program takes data connection and shared business management to the next level. Any interaction or data selection within the ArcGIS Maps tile reflects in corresponding changes to data visualizations across all other analytical tiles. Collaboration is also easier than ever before, as Power BI allows users to share everything from individual figures to entire dashboards with just a few clicks.

Blue Raster is currently developing a Power BI dashboard and map application to visualize, analyze and track data and information for an important health project. The Tracking with Recency Assays to Control the Epidemic (TRACE) project is a new initiative that will contribute to the global fight to reach HIV epidemic control. Because the dashboard application needs to be accessible and usable by many users in many scenarios, the Blue Raster and TRACE teams decided on the ideal combination of Microsoft Power BI and Esri ArcGIS Online.

We are excited to grow our Power BI team and enhance our clients' business intelligence with the power of location data using ArcGIS Maps for Power BI.

Let Blue Raster kickstart your organization’s spatially integrated business dashboard. Contact us today!


Page 2 of 5