Climate

Global Forest Watch Fires: New Fire Monitoring Capabilities

Thousands of fires are burning in the Amazon rainforest in Brazil - the most intense blazes for almost a decade. Global Forest Watch Fires (GFW Fires), an online platform for monitoring and responding to forest and land fires, provides a near real-time view into the current fire activity. Additionally, users can view fire reports and compare historical data on regions all over the world.

GFW Fires Report

New Updates to GFW Fires

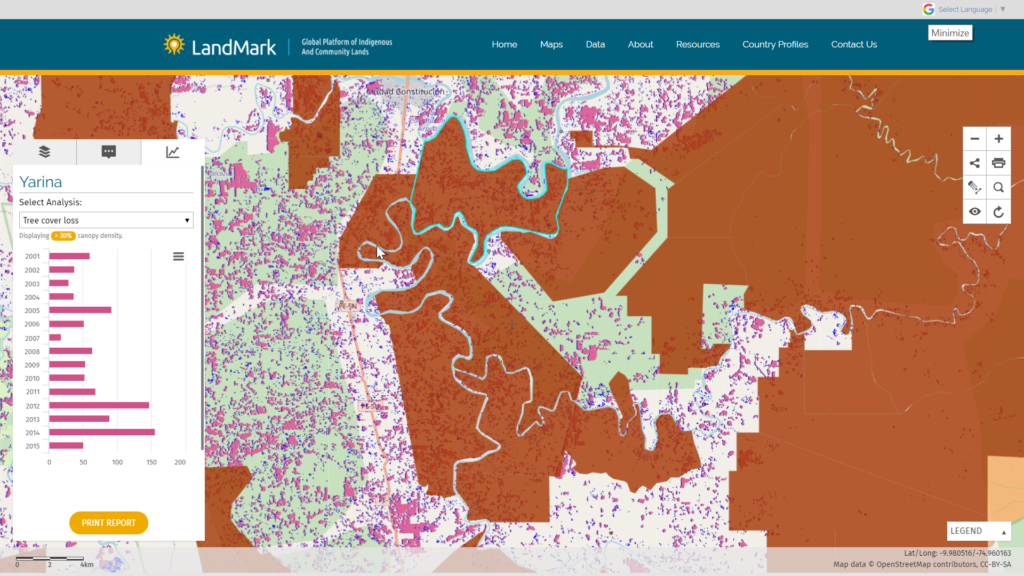
Blue Raster recently worked to add new features and capabilties to the Global Forest Watch Fires application. Want to see details for a specific area on the map? Draw or upload a shapefile to calculate fire counts and subscribe to alerts. Users can select specific areas and see the calculated numbers of VIIRS and MODIS Alerts in the past 24 hours. Next, users can click on the drawn or uploaded shapes on the map to subscribe to alerts for that area.

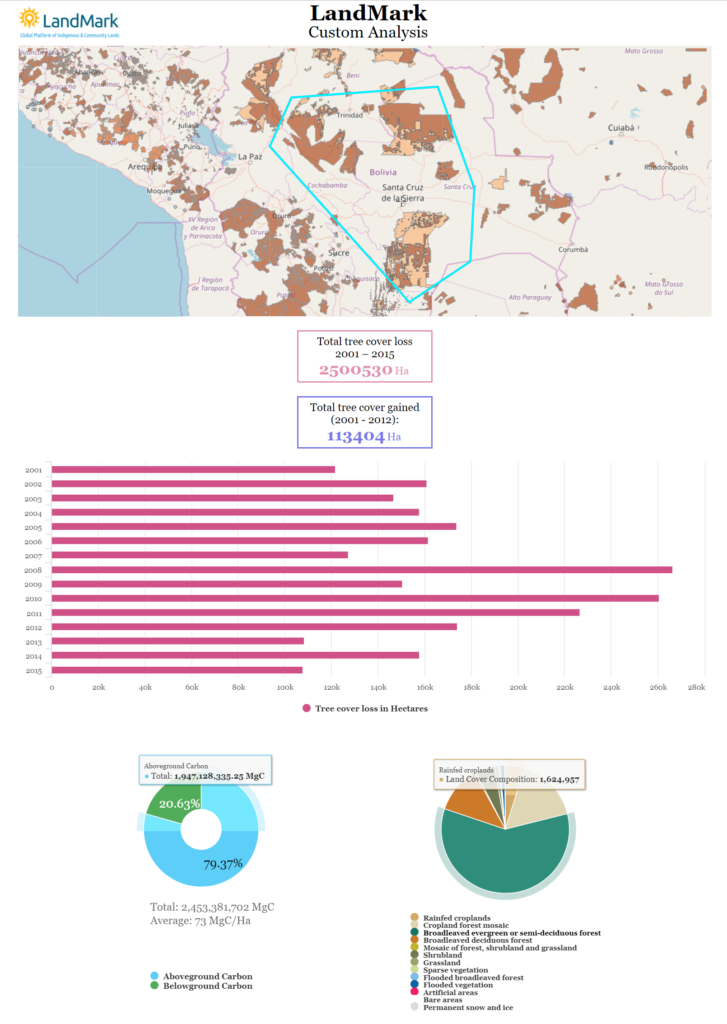
Global Forest Watch Fire Reports provide robust insight into fire history, cumulative fires to date, and a statistical analysis by administrative boundaries within a country or around the world. New to GFW Fires, users can now view charts of unusual fire activity. The report compares fires from the current week to the same week in the previous 16 years. In addition, new charts analyze fire activity in Palm Oil Concessions and Wood Fiber Areas.

Global Forest Watch Fires Report
Fire alerts in the Amazonas region of Brazil.

In addition to the basemap imagery, Global Forest Watch Fires now provides an option for Sentinal Imagery. The latest satellite imagery is available from Sentinel-2 and Landsat 8. Sentinel-2, operated by the European Space Agency, has global coverage in 10-meter resolution, and can obtain updated imagery every 10 days.

Global Forest Watch Fires Sentinal Imagery

By using the latest geospatial technology, Global Forest Watch Fires allows anyone to access near real-time information about where and how forests are changing around the world. Users can monitor fire activity, sign up to receive alerts, or share their own stories on GFW's blog. Explore this interactive map today.

Protecting Indigenous & Community Lands With LandMark

Blue Raster is pleased to work with the World Resources Institute (WRI) on a recent initiative to release new datasets and tools on LandMark– an online, global platform providing maps on Indigenous and Community Lands. The new analysis features and data focus on measuring the impacts Indigenous Peoples have on climate change mitigation and adaptation.

Landmark Tree Cover Loss Analysis

LandMark Tree Cover Loss Analysis

According to a recent study, Indigenous Peoples and local communities manage at least 24% (54,546 MtC) of the total carbon stored above ground in the world’s tropical forests, a sum greater than 250 times the amount of carbon dioxide emitted by global air travel in 2015. Additionally, Indigenous Lands that are legally recognized experience rates of deforestation that are two to three times lower than non-tenure secure lands, according to Peter Veit, director of WRI’s Land and Resource Rights Initiative.

“The new data and analysis features on LandMark take the platform to a new level by not just showing the presence and legal situation of indigenous and community lands, but also their specific contributions to protecting the environment and the threats that they face from outside pressures such as deforestation, concessions, infrastructure development, and more.”

Katie Reytar, a research associate with WRI’s forest program.

Now, anyone can calculate the amount of tree cover loss in specific Indigenous and Community Lands on-the-fly, and learn more information including land cover composition and tree cover density. Additional datasets on the site include:

Landmark Custom Analysis

  • Intact Forest Landscape and Soil Organic Carbon
  • Pressures, including Mining and Oil Palm concessions, and Major dams
  • Land Cover & Change, including annual Tree cover loss and gain all available on a global scale at 30m x 30m resolution

To build the updated site, Blue Raster harnessed the power of ArcGIS Online, an entirely web-based mapping platform that allows organizational access to datasets. By leveraging ArcGIS Online, WRI can add, remove, or edit maps in a matter of minutes and publish their changes instantaneously.

Blue Raster also leveraged WRI’s Global Forest Watch MapBuilder application template to overhaul the design of the map. The map features an improved user-friendly navigation and analysis pane. The MapBuilder template allows anyone with an ArcGIS Online account to turn custom maps into interactive web applications. As part of the project, additional functionality was imported into the MapBuilder core, all of which is formally written in the documentation for anyone to add their own customizations to the template.

See LandMark’s new tools and datasets at www.landmarkmap.org.

Danger in the Air: UNICEF

Blue Raster collaborated with The United Nations Children’s Fund (UNICEF) to help produce Danger in the Air: How air pollution can affect brain development in young children. Leveraging the analysis pioneered during a recent study with UNICEF regarding air pollution, Blue Raster and UNICEF used satellite imagery of outdoor air pollution in combination with global demographic data to determine that 17 million babies under the age of 1 breathe toxic air, with the majority living in South Asia. The report also highlights why young children are the most vulnerable to the impact of air pollution.

Air pollution is a critical health issue to people all over the world. Children are especially vulnerable to air pollution due to their physiology: their lungs are still developing, and exposure to harmful air during this critical period can be especially detrimental, causing life-threatening diseases. A growing number of studies are even pointing to the impacts of air pollution on a cognitive development. They note that breathing in particulate air pollution can damage brain tissue and undermine cognitive development – with lifelong implications and setbacks.

UNICEF has made its mission protecting and empowering children around the world. With Blue Raster’s help, UNICEF identified the youngest children who are most vulnerable to the dangers of air pollution, and promotes a greater understanding of this issue among governments, communities, and families. Further geospatial analysis can help us identify trends, pinpoint sources of pollution, and create plans for reducing pollution in the future.

“Not only do pollutants harm babies’ developing lungs – they can permanently damage their developing brains – and, thus, their futures. Protecting children from air pollution not only benefits children. It is also benefits their societies – realized in reduced health care costs, increased productivity and a safer, cleaner environment for everyone.”

Anthony Lake, UNICEF Executive Director 

Thirsting for a Future: UNICEF

Blue Raster collaborated with The United Nations Children’s Fund (UNICEF) to help produce Thirsting for a Future: Water and children in a changing climate. In a targeted study of Water, Sanitation and Hygiene using current climate and projected climate conditions, Blue Raster and UNICEF determined that by 2040, nearly 600 million children are projected to be living in areas of extremely high water stress. The report also highlights that increasing droughts and floods threaten quality and quantity of water.

As UNICEF puts it best: “No one suffers more from a change in climate than a child. Their small bodies are vulnerable to the changes in the air they breathe, the water they drink and the food they eat. For many children, a change in climate is felt through a change in water. In times of drought or flood, in areas where the sea level has risen or ice and snow have unseasonably melted, children are at risk, as the quality and quantity of water available to them is under threat. When disasters strike, they destroy or disrupt the water and sanitation services that children rely on.”

Blue Raster has (once again!) done an incredible job helping to conduct the analysis for this report. Their professionalism and technical sophistication continues to exceed expectations. In the face of incredible challenges now and in the decades to come, Blue Raster has helped us make the case for protecting children’s access to safe water and sanitation.

— Nicholas Rees, Policy Analysis Specialist, UNICEF New York

With Blue Raster’s help, UNICEF identified the children who are most vulnerable to the dangers of flooding and water stress. Geospatial analysis using ArcGIS Desktop helped to inform plans to mitigate current and future risk to children.

Visualizing Evolution of Atmospheric Deposition

Blue Raster launches the Critical Loads Mapper for the Environmental Protection Agency, the latest tool in a collection of EPA’s Global-Change-Explorer platform. This interactive web application analyzes atmospheric deposition from Nitrogen and Sulfur. Despite abundance in atmosphere and aquatic ecosystems, an excess of Nitrogen can cause significant environmental and health issues, leading to economic impacts across communities. Sulfur, when compounded to form various Sulfur Oxides, can cause health and respiratory problems, damage foliage, and create haze. Working with EPA, Blue Raster created a consolidated source of information, allowing the study of these elements within our ecosystem across a variety of models and timelines.

EPA’s Critical Loads Mapper incorporates a collection of four different respected scientific research efforts, including the National Atmospheric Deposition Program (NADP),  the Community Modeling and Analysis System (CMAQ), Total Deposition Science Committee (TDEP), and the Fifth Assessment Report (AR5) from the Intergovernmental Panel on Climate Change (IPCC). Each group of deposition estimates offers information on a variety of time spans, with some as early as 1851. Concentrations of these pollutants are predicted in deposition models which can help us better understand ecosystems at risk for exceedance of Nitrogen and Sulfur pollution.

In the application, you can overlay Federal lands and Wilderness areas from the Fish and Wildlife Service, National Park Service, and the US Forest Service. In our next release, users will be able to generate Deposition and Exceedance Profiles specific to each area.

With over 500 display options, the Critical Loads Mapper makes it easier for researchers, policy makers, and public officials to access this data, and create styled maps that can be saved, exported, or printed directly from the browser.

The Critical Loads Mapper is optimized to run at high performance, and leverages the ArcGIS Image Server for raster visualization and analysis. In addition, the application is built using Knockout, a JavaScript library that renders JSON (data) objects into html, for a simpler and more dynamic user interface experience. HTML5 Canvas, an html element, is the backbone for all of the on-the-fly printing capabilities. Each component of the application works to support the immense data being supplied while providing a user interface and user experience that is easily navigable and reliable.


Page 2 of 4