Environment

Ceres Maps Analyze Drought and Ground Water Depletion in Shale Development Areas

With hydraulic fracturing and horizontal drilling on the rise  in the United States, many regions have become at risk for water availability. To help highlight these areas, Blue Raster created a series of Hydraulic Fracturing & Water Stress maps for Ceres using Esri’s ArcGIS Desktop software and Adobe Photoshop. Through these maps, users can view eight regions of intense shale development in the United States and Canada, and the degree to which these areas are under stress.

Ceres Drought Monitor Map and Shale Energy Development

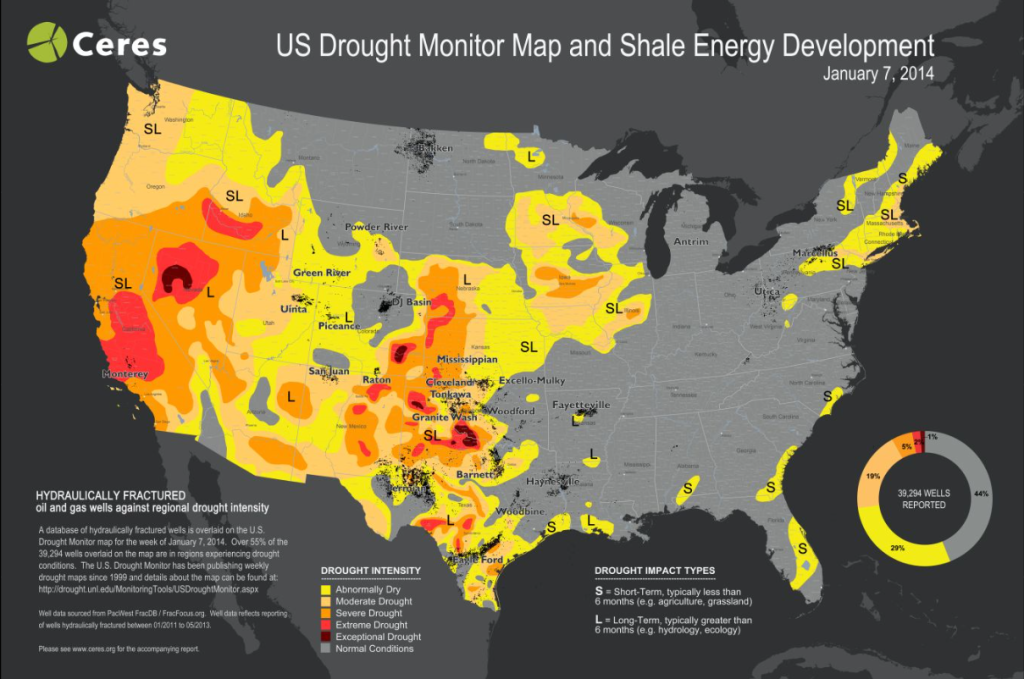
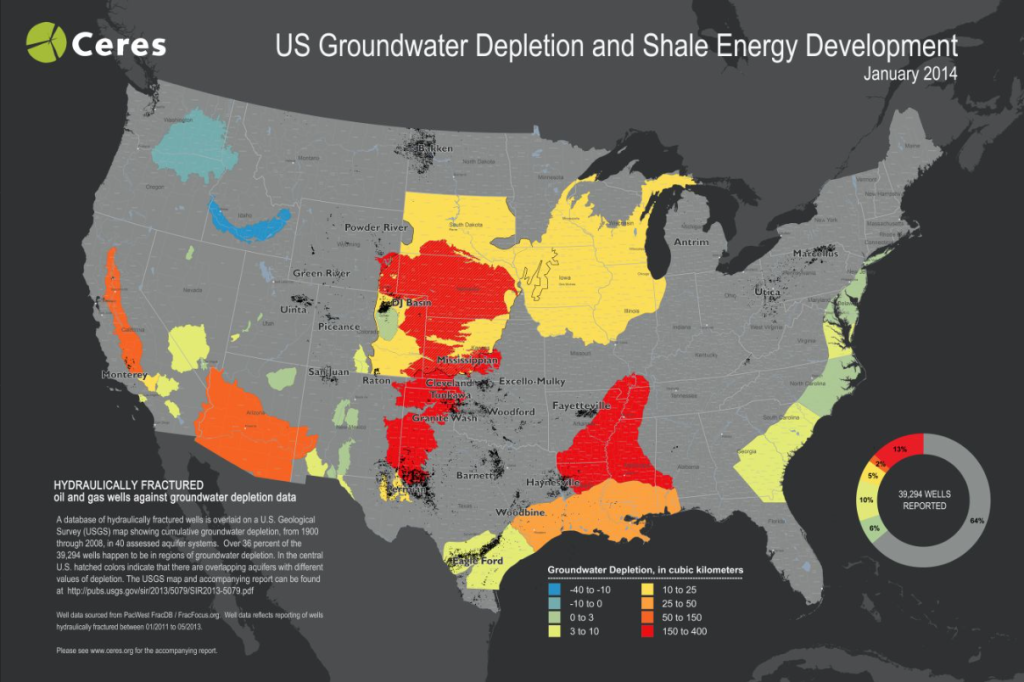
Featured in CERES’ latest report: Hydraulic Fracturing & Water Stress: Water Demand by the Numbers, the maps provide investors, lenders, and regulators with sustainable recommendations for minimizing their water demands. With more than 55% of U.S. wells located in areas amid drought, and 36% percent in areas experiencing groundwater depletion, the maps serve as resources for ensuring a long term sustainable strategy for industries in shale energy development.

Ceres Drought Monitor Map and Shale Energy Development

To learn more about the project and to view the maps, visit Ceres’ Hydraulic Fracturing & Water Stress page.

New WRI map confirms long suspected notions of natural resource rights across sub-Saharan Africa

The World Resources Institute (WRI) announced today the launch of their newest online mapping application, the Rights to Resources map. Built by Blue Raster, the tool visualizes resource rights in Africa and allows users to compare findings across countries and resources: water, trees, wildlife, minerals and petroleum.

The data displayed in the tool is the outcome of WRI’s systematic review of the national framework laws across the 5 resources. The results of which confirm long suspected notions that across sub-Saharan Africa, few national laws provide communities with strong, secure rights to the resources on their land and that rights to many high-value natural resources are held by the state.

Rights To Resources Map

For instance, take WRI’s example of the situation in Ghana:

 “Naturally-occurring trees are nominally owned by the chieftaincy or traditional authorities, but commercial rights to timber species belong to the state.  With only weak rights, many farmers are reluctant to plant timber trees. Some resort to destroying or removing trees on their farms before logging companies come to harvest.”

The new Rights to Resources application endeavors to strengthen and secure resource rights for communities in sub-Saharan Africa while incentivizing sustainable management of local resources.

To learn more about the project and review the application, check out WRI’s Land and Resource Rights project page.

NFWF maps 12K Conservation Grants with ArcGIS

To help illustrate the extensive geographic reach of their mission and impact of their conservation programs, Blue Raster built the Where We Work web map for the National Fish and Wildlife Foundation (NFWF). The mapping application allows supporters to visualize where NFWF is working and learn more about individual grants of interest. Matt Foster, Monitoring and Biodiversity Officer at NFWF, has this to say about the map – “The interactive map showing NFWF projects over the past 30 years is a great asset.  It really helps to convey the breadth of NFWF work in the U.S. and around the world and describes the wide range of actions that we support.”

NFWF Grant Mapper

Built on ArcGIS for Server using the ArcGIS API for JavaScript, NFWF’s Where We Work map allows filtering based on time, location, and various other grant attributes including the associated conservation program. The Flickr API provides images for the various projects.

The National Fish and Wildlife Foundation (NFWF) is a Congressionally-chartered foundation, specifically charged with the administration of monies to “further the conservation and management of fish, wildlife, plants, and other natural resources” of the United States (National Fish and Wildlife Foundation Establishment Act, 16 U.S.C. §3701 et seq.). Since 1984, NFWF has become one of the world’s largest conservation grant-makers with more than 12,100 grants totaling over $2.1 billion.

WRI: New Agricultural Exposure to Water Stress map

Blue Raster recently worked with the World Resources Institute (WRI) to build the Agricultural Exposure to Water Stress interactive map which highlights the intersection between 20 commodity crops, from coffee to cocoa to oranges, with different levels of baseline water stress.

WRI describes water stress as “the ratio of total water withdrawals to the available renewable supply in an area. In highly water-stressed regions, 40 percent or more of the supply is used annually. When that ratio gets up to 80 percent, it’s considered extremely stressed.”

Agricultural exposure to water stress

The new series of maps designed by Aqueduct analyst, Francis Gassert, reveals where crops are grown in areas of high competition for limited water supplies and shows that 56% of irrigated agriculture face high water stress. The tool allows users to zoom to areas of irrigated and non-irrigated farm land around the world and visualize where the demand for water is greatest. With water demand forecasted to increase 50% by 2030 due mostly to agriculture, the tool helps show the urgency of finding sustainable means for food production.

Coverage of the Aqueduct Commodities Interactive Map appeared in Energy & Environment (subscription) and Salon, among others.

Guerrilla Gardening- Baltimore Crowdsourcing Map

Blue Raster enabled BNIA-JFI (Baltimore Neighborhood Indicators Alliance-Jacob France Institute) to setup and launch their new interactive map for community gardens and open spaces in Baltimore with ArcGIS Online Accelerate. The Interactive Map of Community-Managed Open Space assists city residents in discovering natural spaces they can protect, claim, and effectively use for their community in an urban location. Take a look at this video to see the site in action. The site also allows users to search by address or garden, view gardens by categories and submit pictures.

Interactive Map of Community Managed Open Space

Seema D. Iyer, associate director of the Jacob France Institute at the University of Baltimore’s Merrick School of Business, said that the website will help communities and community-based organizations visualize where greening efforts have been occurring as they work to coordinate resources:

“BNIA-JFI utilized Blue Raster’s ArcGIS Online Accelerate program to help launch an online mapping platform for data that we integrated from five different organizations with overlapping information.  Blue Raster quickly understood our technical needs, met our aggressive timeframe, helped us build our own internal capacity to maintain the site, and provided professional advice on how to augment the site in the future.  We look forward to working with them again.”

ArcGIS Online and Flickr API allowed five different organizations – Baltimore Green Space, Parks and People, Master Gardeners, the Johns Hopkins Center for a Livable Future and Baltimore City’s Power in Dirt project – to aid governmental and non-governmental agencies synchronize “greening activities”. The Interactive Map of Community-Managed Open Space is helping local groups across the city preserve uncluttered space.


Page 17 of 24