Esri

ArcGIS Solutions for Emergency Management Workshop

Emergency Managment Disaster Response training

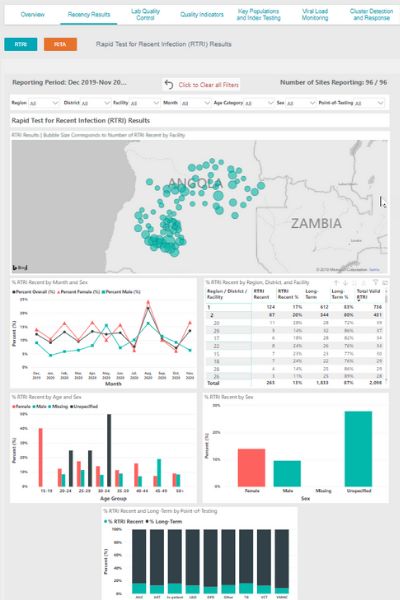
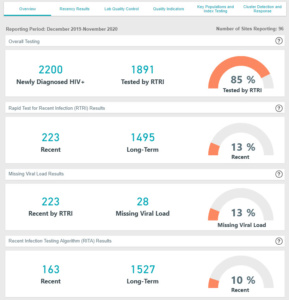
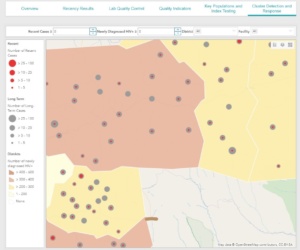
Both man-made hazards and natural disasters significantly impact populations across the globe. Advanced preparation is becoming more critical than ever, especially within the government entities that manage crisis response and emergency management. To answer this demand, Esri has organized a new category of out-of-the-box toolsets designed to mitigate the risk of hazards and delegate resources in the wake of disasters.

ArcGIS Solutions for Emergency Management encompasses a range of products that help emergency management officials to manage response resources and visualize events as they occur across time and space. Earlier this month, the Blue Raster team attended a workshop on this program set at Esri’s Redlands Campus in Southern California. This event focused heavily on the Emergency Management Operations Gallery group, which features seven applications with seven unique maps and 33 total feature layers.

Emergency Management Disaster Response training
Emergency Management Disaster Response

Our team gained significant experience with each of the applications, from configuration to deployment. We were particularly impressed by the cross-component integration and real-time feature updates. Once properly configured, this toolset features an extremely user-friendly interface with numerous options for customization of outputs and data visualization. Furthermore, one-click data inputs and feature updates result in fast and efficient communication of changing conditions.

20190730_172501

Blue Raster is excited to add ArcGIS Solutions for Emergency Management to our continuously growing line of GIS professional services. We look forward to being able to contribute to emergency management preparedness and disaster response efforts.

ArcGIS Urban: Take City Development Further

Blue Raster Project Manager Megan Gottfried took her ArcGIS Urban skills to the next level at Esri’s "Deploying ArcGIS Urban" training. The training, held in San Diego just before Esri’s annual User Conference, included other Esri business partners, distributors, and advanced level users from around the world.

ArcGIS Urban is gaining significant attention in the GIS and City Planning & Development industries. The platform is a complete solution allowing municipal planning departments and development-focused NGOs to improve urban planning practices and decision-making on a city-wide scale. Users can use ArcGIS Urban to create 3D renderings of city landscapes, proposed buildings, and compare proposed site projects across key stakeholders.

ArcGIS Urban case study

Megan Gottfried used San Francisco as a study area for development and used ArcGIS Urban technology to assist the city’s urban planners with the growing issue of overcrowding. Key program features such as theoretical population and employment projections helped officials to understand the regional severity of the problem and work to find innovative solutions, while 3D building renderings with zoning and building setback details gave realistic building city scapes for user exploration.

San Francisco City
"Today's advanced GIS software can now model cities in 3D and integrate the full planning workflow, thereby dramatically enhancing efficiency and effectiveness."

- Scott Edmondson, Senior Strategic Sustainability Planner for the City of San Francisco

Other highlights of the training session included a product demo and an overview of the ArcGIS Urban system. in addition, Megan Gottfried was able to learn both the back-end and front-end ArcGIS Urban platform and provide clients with tips and best practices for deployment. Megan tested the many features of the ArcGIS Urban program and created sample projects & planning files for the San Francisco area. The event concluded with a Q&A session where Megan and her colleagues were able to ask questions about the program and troubleshoot some of their problems.

ArcGIS Urban Site Project

Learn More

Blue Raster is excited to begin offering ArcGIS Urban solutions for our clients. Are you interested in harnessing the power of informed planning for your business or municipality? Contact us today!

Contact Us

  • This field is for validation purposes and should be left unchanged.

Esri User Conference 2019: The Blue Raster Experience

Esri UC: The SuperBowl of the Geospatial Industry

The Esri User Conference is the biggest GIS event of the year. This year, the San Diego Convention Center was once again filled with a record-breaking number of geolocation enthusiasts; over 17,000 attendees. The Blue Raster team was excited to participate and showcase our latest work, meet new friends and learn from other GIS professionals.

Blue Raster Team at Esri UC 2019

With ideas flying and new technologies being unveiled, we walked away excited for what is to come:

  • Esri ArcGIS Hub – It was amazing to see all the ways cities and organizations are partnering with residents, non-profits, business, and universities through ArcGIS Hub. The Hub work that the City of Zwolle, Netherlands, and the District of Columbia government are doing was super inspiring!
  • ArcGIS Urban – This is the ultimate city planning tool. It takes into account setbacks, zoning regulations and overrides, and provides capabilities to compare large-scale 3D projects across multiple parcels and development projects.
  • ArcGIS Indoors – ArcGIS Indoors is enabling organizations to provide the ultimate workplace experience for employees through workplace maps and location data to better manage workplace operations. We are proud to announce our new ArcGIS Indoors specialty from Esri.
  • ArcGIS Enterprise 10.7.1 – This new version of ArcGIS Enterprise has reduced server memory requirements have by 95%. This means that the same hardware should be able to do MUCH more now.

The conference kicked off with the Opening Plenary featuring Dr. Jane Goodall and an exciting new StoryMap, ENGAGE – LISTEN – UNDERSTAND – ACT, that the Jane Goodall Institute and Blue Raster teamed up to create. Built with the brand new StoryMaps for ArcGIS template, this story map outlines concerns over chimpanzee populations and the environment, the steps in the process of 'Tacare' approach toward conservation, and success stories with this conservation approach. We are so grateful to have had the opportunity to work with the Jane Goodall Institute and meet Jane and her team at the UC conference this year. We hope to see Jane in DC when she visits in September.

Jane Goodall and the Blue Raster Team
Danny Cassiday at Esri UC 2019

On Monday, one of our GIS Analysts, Danny Cassiday, brought his knowledge to sunny California to present a lightning talk "My Life as a (Version) Control Freak: Versioning ArcGIS Online Items with Python" sharing his experiences and thoughts on applications of Python in versioning ArcGIS Online items.

On Tuesday, Blue Raster was proud to sponsor and attend the Sustainable World Social, a networking event focusing on the applications of GIS in the context of conservation and sustainability.

Following the social, we headed over to our annual Fish Taco Night at the South Beach Bar & Grille.

Blue Raster Taco Night  at South Beach Bar & Grille
Blue Raster Taco Night
Blue Raster Team at Taco Night

We enjoyed seeing all those who stopped by our booth this year, from professionals in conservation and forest management to real estate development and utility support. We were able to demo some of our latest applications and invited attendees to visit our Map Gallery Posters. The Gallery featured our work with Forest Stewardship Council providing an interactive outlet through ArcGIS Operations Dashboards to explore where FSC Certified Forests and Certificates currently are located for verification and accountability purposes as well as our partnership with The Demographic and Health Surveys (DHS) Program, USAID, UNICEF, and the Nature Conservancy utilizing ArcGIS StoryMaps to track the progress of the Sustainable Development Goals. We also had the opportunity to display a poster covering the drone missions we flew with The Green-Wood Cemetery using Esri’s Drone2Map and ArcGIS Online Web Scenes to provide high-quality imagery that will identify invasive grass for measurement and monitoring in partnership with Cornell University.

Forest Products without Compromise map
Measuring Success map
Improving Drone Missions with Lidar Support map

Wednesday evening was family night, allowing us to engage with the entire GIS community and interact with enthusiasts, young and old. Our Blue Raster temporary tattoos were a hit with the kiddos! Between our booth on the expo floor, the many sessions and socials, family night, and our legendary fish taco night, we had so many wonderful moments. Check out some of our favorites:

Family Night at Esri UC 2019
Christina passing out candy at Family Night.
Some of our favorite moments from the UC this year
Blue Raster booth for Esri UC 2019
Our Blue Raster women in GIS Esri UC 2019

Interested in working with us?

Reach out to see how we can help you harness GIS technologies, mapping solutions, and data analysis to tackle the challenges you face.

Highlighting Jane Goodall’s Conservation Approach with a New Story Map

ENGAGE - LISTEN - UNDERSTAND - ACT

Timed to coincide with Dr. Jane Goodall’s plenary speech at the 2019 Esri User Conference in San Diego, California, Blue Raster, Esri and the Jane Goodall Institute teamed up on an exciting new Story Map.

ENGAGE – LISTEN – UNDERSTAND – ACT, built with the brand new ArcGIS StoryMaps template, tells the story behind the ‘Tacare’ approach toward conservation. The story map outlines concerns over chimpanzee populations and the environment, the steps in the process of Tacare, and success stories with this conservation approach.

Beginning with an overview of how Jane Goodall first became involved with conservation through her work with chimpanzees, the story unfolds as Jane noticed that much of the forests in Western Tanzania, home to her beloved chimpanzees, had become barren hillsides after years of farming and other human related activities in the area. She realized that the only way to conserve chimpanzees and their habitat was to work directly with local people and communities. The story map we created titled, Engage - Listen - Understand - Act, explains this holistic approach and some of the successes the area has already seen through the work of Tacare.

Blue Raster is honored to have had the opportunity to help create the first dedicated web presence that details the Jane Goodall Institute's Tacare conservation approach and is especially thrilled to have been able to use the latest version of the next-gen StoryMaps builder.

An all-star team, including master storyteller Allen Carroll from Esri and Lilian Pintea, VP of Conservation Science at the Jane Goodall Institute, worked in collaboration with Blue Raster to produce ENGAGE – LISTEN – UNDERSTAND – ACT.

The new Story Map builder helps the reader flow seamlessly through the story of Tacare; the application intersperses captivating photos taken on the ground in Tanzania and interactive mapping elements that display chimpanzee ranges across Western Tanzania and the African continent. Success with Tacare can be seen in "before" and "after" aerial imagery, which helps readers to visualize the reforestation occurring in the area.

Jane Goodall photos

Not only does this story map detail the incredible conservation efforts led by the Jane Goodall Institute but it also serves as a call-to-action for other conservation efforts and organizations around the world. Conservation is in the hands of local people - by understanding the needs of local communities, we are then able to help create a sustainable future for our world.

BR_JGI

This story map will be displayed at the Esri UC Conference. If you're attending, make sure to check out Blue Raster's booth!

For more info about our work with the Jane Goodall Institute, read our blog post about our dashboard project in Tanzania.

The TRACE Initiative: Using real-time data to identify hot spots of current HIV transmission

The Tracking with Recency Assays to Control the Epidemic (TRACE) project is a new initiative that will contribute to the global fight to reach HIV epidemic control. With funding from the President’s Emergency Plan for AIDS Relief (PEPFAR) through the Centers for Disease Control and Prevention (CDC), TRACE is being implemented with technical assistance from ICAP at Columbia University’s Mailman School of Public Health and the University of California San Francisco (UCSF).

Power BIPower BI Dashboard

Blue Raster is developing a dashboard and map application to visualize, analyze and track the recent infections and identify hot spots where action may be directed. The dashboard application needs to be accessible and usable by many users in many scenarios. After assessing multiple options, the Blue Raster and TRACE teams decided on the ideal combination of Microsoft Power BI and Esri ArcGIS Online.

In the first year of the project, ICAP will support the roll-out of rapid recency testing in six countries in sub-Saharan Africa: Eswatini, Ethiopia, Lesotho, Rwanda, Tanzania, and Zimbabwe.

Through TRACE, new medical and technological innovations are combining in a powerful way:

Medical:

  • TRACE is supporting select countries to begin implementing the use of Rapid Tests for Recent Infection (RTRI) which are capable of distinguishing between recent and long-term infections.
  • The test can be completed in 20 minutes during a routine exam

Technological:

  • Powerful, accessible and easy-to-use Business Intelligence platforms are in easy reach of public health organizations.
  • The explosion in online GIS and mapping capabilities brings the ability to analyze and visualize data by geospatial attributes to the screens of more people than ever before.

TRACE dashboard


Blue Raster is honored to support all efforts to reach HIV epidemic control through our work on projects like TRACE and the ICAP’s Population-based HIV Assessment (PHIA) project. Today’s availability of extensible, easy-to-use and cost-effective online tools will equip future generations with accurate and complete information about burden and distribution of disease. Furthermore, this will guide decision making to ensure that resources are efficiently allocated.


Page 9 of 17