Our Work

Blue Raster helps you tell your story through interactive
mapping technology. Make your message clear, exciting,
and user-friendly for both mobile and web platforms.

Finance

Innovation 2.0: Draper Innovation Index launches new version

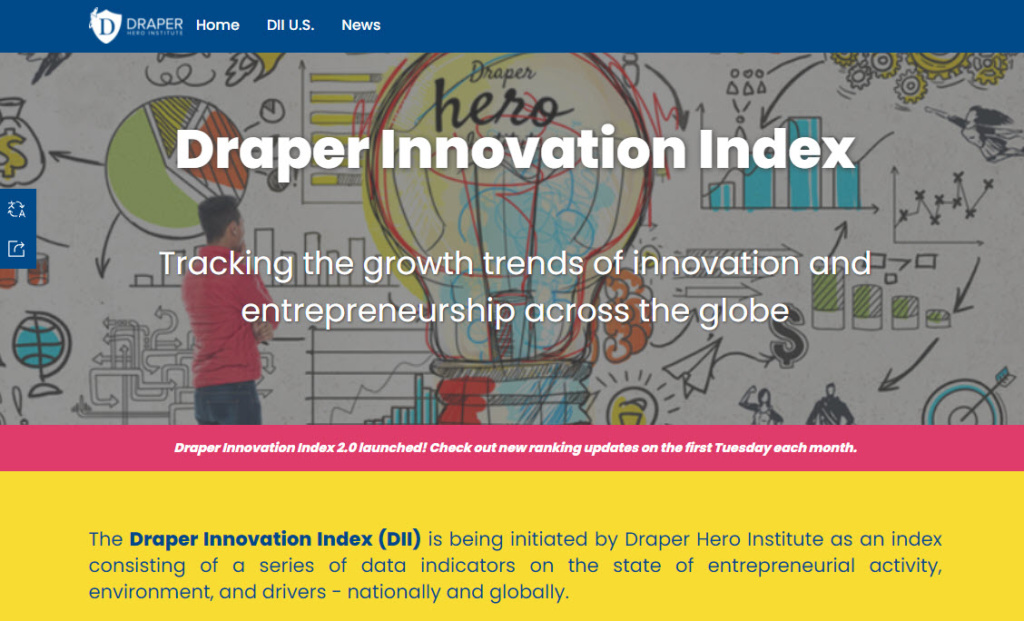
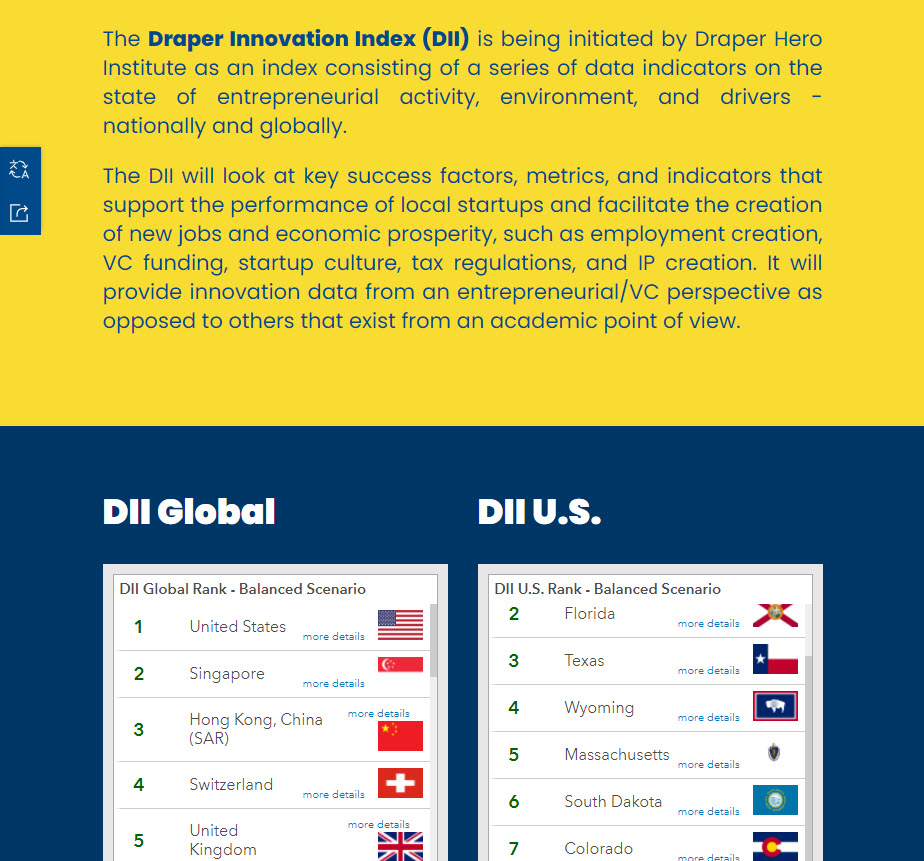
Following up on the previous versions of the Draper Innovation Index (DII), Blue Raster is proud to announce the launch of the Draper Innovation Index Global 2.0. According the the Draper Hero Institute (DHI) the ArcGIS Hub site “will be the first index of its kind to be updated monthly to reflect the most current state of the ever-evolving state of economic opportunities, economic freedom for innovators, entrepreneurs, and investors around the globe.”

A collaboration between DHI and Blue Raster, the Draper Innovation Index consists of ArcGIS Dashboards, StoryMaps and Hub.

What is new in this Draper Hero Institute update:

  • The DII Global’s Government Quality category now incorporates the Economist Intelligence Unit’s Democracy Index, which evaluates nations based on five indicator categories: electoral processes and pluralism, government functioning, political participation, political culture and civil liberties. First published in 2006, the Democracy Index draws on survey questions and expert analysis and is updated quarterly. It classifies nations into four categories: full democracies, flawed democracies, hybrid regimes, and authoritarian regimes.
  • The DII’s new Country Sentiment Index, a proprietary DII algorithm, incorporates three main components:
  • S&P Dow Jones’ Global Equity Indices, which measures changes in equity markets, in a specific country or region;
  • Currency fluctuations in relation to the price of Bitcoin;
  • The World Uncertainty Index (WUI), created by International Monetary Fund and Stanford University economists in 2018 as “the first effort to construct a panel index of uncertainty for a large set of developed and developing countries.”

Tim DraperThese additions enable the DII Global to better accomplish its core mission, providing a global look at which countries and regions have the freest economies and the best, most supportive environments for innovation, entrepreneurship, and investment,” said DHI Founder Tim Draper. “This knowledge is more important now than ever, as the competition for employers, skilled workforce, and capital has only become fiercer since governments now need to compete globally for innovators.

Make sure to revisit the DII Global each month to see how rankings continue to shift based on the most current data.

Explore Innovation and Entrepreneurship in the USA with The Draper Innovation Index U.S.

Following the launch of the Draper Innovation Index (read about it here) in March, Blue Raster is excited to announce the launch of the US focused Draper Innovation Index U.S. (DII U.S.) available at index.draperhero.org.

Built using ArcGIS Hub, ArcGIS Dashboards, and ArcGIS StoryMaps, the DII US includes three major scenarios: Balanced, Tech Innovation Environment and Regulatory and Tax Environment. These scenarios weight six sub-indices, providing a look at state performance in a variety of categories.

Continuing the partnership that launched the global Draper Innovation Index, the Draper Hero Institute, Blue Raster and Esri collaborated on the project.


“The ability to drill-down and understand the Draper Innovation Index at a more granular sub-national level is essential to understanding which states could be a good environment for innovation and economic investment,” said Salim Sawaya, Lead for location intelligence technology provider Esri’s Nonprofit & Global Organizations Team. “Esri and our partner Blue Raster continue to support the Draper Hero Institute find and use authoritative datasets for their US states index so that investors and innovators can leverage the power of location intelligence through GIS to identify the states that hold the most potential or promise.”


About Draper Hero Institute

Founded by legendary Silicon Valley venture capitalist and entrepreneur Timothy C. Draper, Draper Hero Institute (DHI) provides applicable and modern resources for future entrepreneurs globally and ensures inclusiveness and opportunities for all.

Tracking Trends of Innovation and Entrepreneurship with The Draper Innovation Index

Draper Hero Institute, Esri and Blue Raster team up to launch the Draper Innovation Index

Founded by legendary Silicon Valley venture capitalist and entrepreneur Timothy C. Draper, Draper Hero Institute (DHI) provides applicable and modern resources for future entrepreneurs globally and ensures inclusiveness and opportunities for all.

A key example of one of those modern resources is the recently launched Draper Innovation Index.

The Draper Innovation Index is a Hub for ArcGIS site that contains several ArcGIS Dashboards and a StoryMap that displays key success factors, metrics, and indicators that support the performance of local startups and facilitate the creation of new jobs and economic prosperity, such as employment creation, VC funding, startup culture, tax regulations, and IP creation. Additionally, it provides innovation data from an entrepreneurial/VC perspective as opposed to others that exist from an academic point of view.

Draper Innovation Index

When Esri looked for a partner to take over the project after they had built the initial Hub, Dashboards and StoryMaps collection of tools called the Draper Innovation Index – they tapped longtime collaborators and Esri Gold Partner Blue Raster on the shoulder.

The Draper Innovation Index (DII) was initiated by Draper Hero Institute as an index consisting of a series of data indicators on the state of entrepreneurial activity, environment, and drivers – nationally and globally. Under the leadership of Program Manager Phil Satlof ; GIS Analyst Mary Bracho and Visual Designer Manny Fleurival adapted and enhanced the Hub and tools and participated in the global launch event on March 25th, which was covered by the Wall Street Journal.


With our goals to create a global index to foster the development of innovative technology and economic growth, Blue Raster and their team seamlessly achieved our vision. They transformed the complex data metrics and analysis into a user-friendly, visually aesthetic interactive tool. With the successful launch of our global index, we are excited to share this leading-edge tool with the world.” — Vivian Lufkin Executive Director, Draper Hero Institute”

We are now preparing for the launch of the USA Index on May 27th! Check index.draperhero.org for more news.

Draper Innovation Index

Clearview Analytics Tool: Accelerating Economic Insight

Avenu Insights, a company focused on improving and maintaining revenue streams for state and local governments, and Blue Raster have just released the first iteration of the Clearview Analytics Economic Development Insights (EDI) tool. The Economic Development tool provides key insights to cities and counties to attract new business, plan future investments, and understand the competitive landscape. The tool is completely interactive and allows users to enter, analyze, and export data for their unique area of interest.

Input an address or select a point on the map to create reports using drive time distances that visualized areas of economic influence and reach

Economic Insights

The new tool uses Avenu Insight's Property Tax and Commercial Sales Tax in combination with ArcGIS GeoEnrichment and Analysis capabilities for site-level analysis of tax revenue. Some of the features of this tool include:

  • Integration with key Demographic and Economic indicators from the ArcGIS GeoEnrichment API to assess market suitability
  • Drive-Time Analysis capabilities from ArcGIS Online to set market areas of interest
  • Up-to-date Property and Sales Tax Revenue data on a quarterly reporting basis, broken down by NAICS code at the individual property level

Providing cities and counties this analysis tool is critical in supporting the economic growth and future success within that landscape. With this tool, businesses and Governments can answer a variety of questions they might have:

"What is the current composition a specific area by business sector?" or "How much growth has retain seen in the central business district in the past few years?"


Econimic Insight tool

For a limited time, Avenu is offering a Free Trial of the Clearview EDI tool for your jurisdiction. Don't miss this opportunity to be a pioneer for this tool and provide feedback for future iterations.

Blue Raster worked closely with Avenu Insights to build out this tool through design, development, deployment using the latest Esri Enterprise 10.7.1, the ArcGIS API for JavaScript, and Esri's Geoenrichment API. In addition, our team worked with Avenu Insights to configure and maintain their ArcGIS Enterprise Server. Our team is excited to continue GIS analysis and capabilities which support healthy economies.

Want to learn more about GIS for Economic Insight?

Contact us today!

China: Then and Now – A Story Map

Recently, Matthews Asia collaborated with Blue Raster to launch “China: Then and Now”, a new story map spotlighting China’s economic transformation. The story map explores China’s demographics, rapid adoption of mobile technology, and innovations in health care.

Story Map home screen

The story map begins with a historical overview of Ancient Chinese innovations, and then transitions into exploring today’s Modern China. It concludes with a look at how modern investors are incorporating investment opportunities in China to create globally diversified portfolios.

The making of the story map

To ensure the story map would be easy to navigate, easy to share, and easy to engage with, our team leveraged Esri’s Cascade story map template. To start, we created a color scheme and story board that reinforced the juxtaposition between Ancient and Modern China.

Mood board colors

To create a consistent storytelling narrative, we placed all graphics relating to Ancient China on the left side of the story map, and tinted them with warm shades reminiscent of Ancient Chinese traditions (Chinese lanterns, calligraphy, and architecture). We chose a palette of deep reds, warm yellows, and tans, and wove in pulp & paper-textures to continue the authentic feeling. To ensure the maps also felt authentic, our team customized a vector basemap to recreate the look of antique maps from that era.

For Modern China, we placed visuals on the right side of the story map, and tinted them cool, neon tones that reinforced a futuristic, innovative feeling of today’s China.

Big cities in China

Work With Blue Raster to Share Your Story

Ready to dive into story maps? Contact our story map experts below to get started today.

  • This field is for validation purposes and should be left unchanged.

Or, get in touch by email: info@blueraster.com