Health

World AIDS Day 2017: Blue Raster visualizations in PHIA Project Reports

On World AIDS Day 2017, the PHIA Project announced the release of new survey data from five countries, bringing the total number of countries with released survey data up to 7.

In 2016 Blue Raster developed and the launched the PHIA Project communications site.  More information can be found here.


Blue Raster works closely with the PHIA Project survey and communications teams to determine the best methods to display the data for the report audience. Find the reports and other information at the PHIA site: http://phia.icap.columbia.edu/

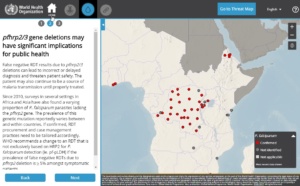
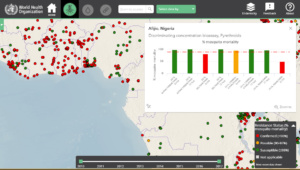
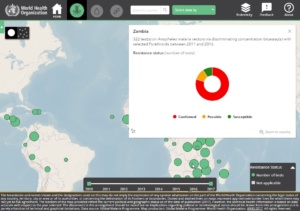
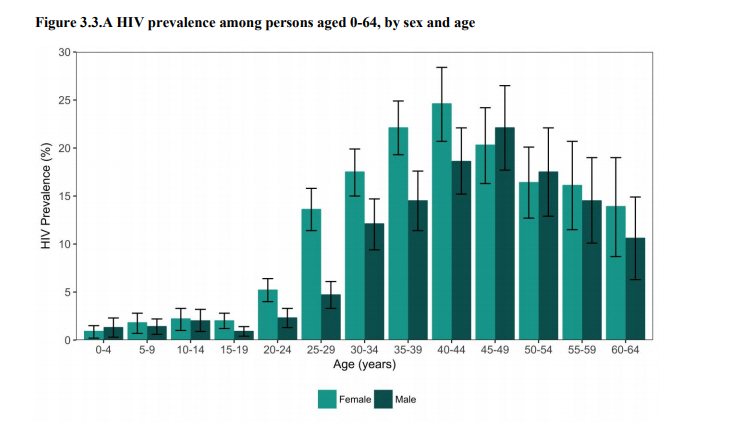
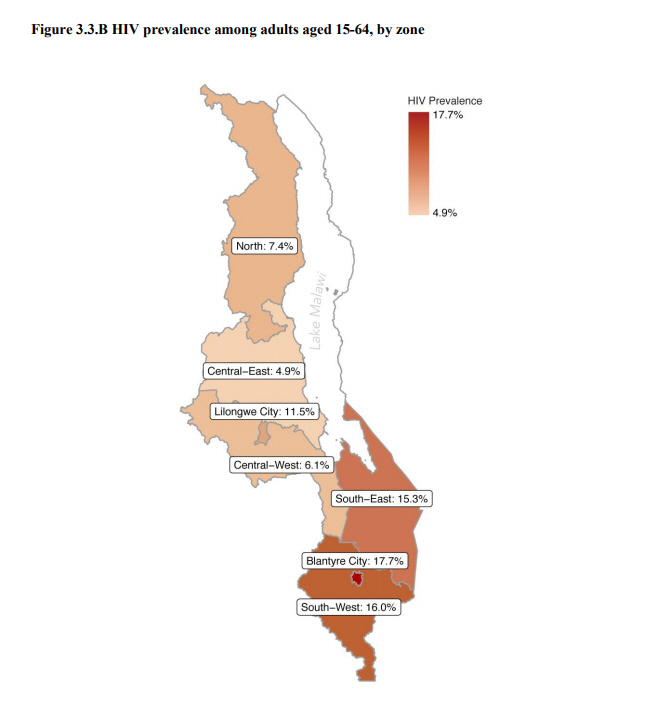
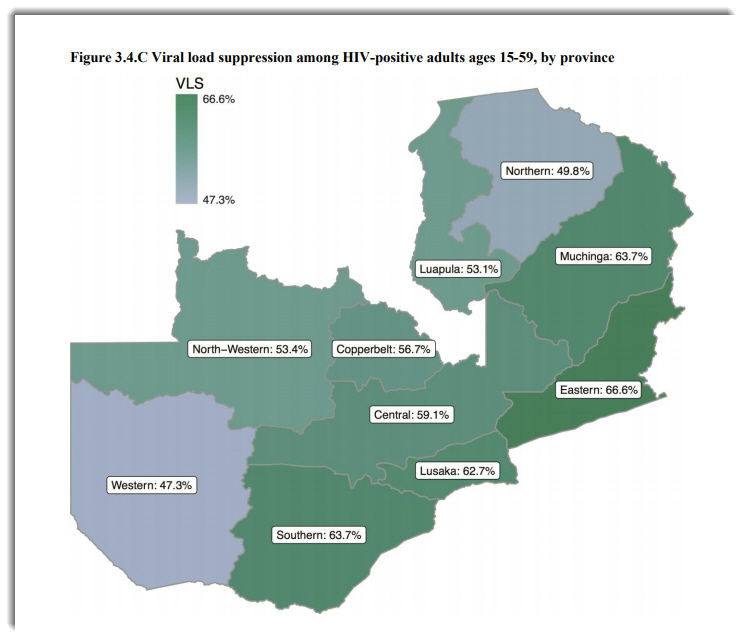
As in previous PHIA reports, Blue Raster  created the maps, charts and graphs that tell the story of these important HIV surveys.

Maps are created in ArcGIS Pro while the charts and graphs are created in R and finished in graphic design editing suites.

In 2018 Blue Raster will develop the PHIA Data dissemination site to provide access to online visualizations and data downloads.

The PHIA Project is led by ICAP at Columbia University – in partnership with US Centers for Disease Control (CDC).  The project receives funding from PEPFAR- the President’s Emergency Plan for AIDS Relief.

WHO Malaria Threats Map: Tracking challenges of malaria control to 2030

Blue Raster is proud to announce the debut of the Malaria Threats Map application, a collaboration with the World Health Organization (WHO) aimed at tracking biological challenges to malaria control and elimination.

Recent trends are emerging that necessitate a need for authorities to adapt plans for control and elimination of Malaria and counter the growing threat.

The application is the sole source for linked spatial and analytical data about these three trends:

  • Vector Insecticide Resistance -resistance of malaria mosquitoes to insecticides
  • Parasite Gene Deletions-Gene deletions among some malaria parasites cause false negative diagnostic test results
  • Parasite Drug Resistance– Resistance of malaria parasites to artemisinin, core compound of the best available antimalarial medicines – threatens antimalarial drug efficacy

The application offers a story-map like feeling by introducing data through curated narratives and is available in English, French and Spanish.

Using technologies such as ArcGIS for Server, ArcGIS API for JavaScript, React, Redux, and HTML5 the application displays detailed information to users and allows them to filter for thousands of historic outcomes.


Phase I of the application was completed in 2017 with plans for a Phase II in 2018.


 Read more about the application on the WHO site.


GIS for Community Engagement with the World Bank

With over 2,000 projects benefiting 3.5 million people, the Azerbaijan Rural Invest Project (AzRIP) launched by the World Bank has been extremely successful in advancing the lives of everyday people by improving infrastructure in rural areas. Since its launch in 2005, the World Bank has assisted in a variety of projects including improving road conditions, health clinics and schools, and access to clean water. With so many projects across the 56 Rayons of Azerbaijan, Blue Raster was eager to help them create a map that had two goals: provide the Azerbaijani citizens a window into AzRIP's activities within the community and help investment teams make more focused, data-driven decisions.

A Commitment to Success

The World Bank has a commitment to success: each project works towards eradicating extreme poverty and promoting shared prosperity. The development of this web application is crucial to increase the community engagement of those benefiting from the investments, and we need to know what works when it comes to impacting everyday lives.

The application allows users to easily search by the type of investment project, with symbology that immediately translates the spread of certain types of investment projects and how these exist within communities and across borders. Also important was the ability to search by Rayon, year, and number of beneficiaries, to help understand the progression of these projects over time.

The Right Product

Because the projects are continuously evolving, Blue Raster worked with the World Bank to find a GIS solution providing organizational access to and ongoing management of the map. The Map is built utilizing ArcGIS Online, a complete, cloud-based mapping program that delivers these institutional requirements.  ArcGIS API for JavaScript provides the web framework for robust data visualization and data editing.

Throughout the development and launch of the application, Blue Raster assisted with international launch events attended by top government officials and stakeholders.  We love to meet the people who can use the application in their everyday lives and show them the power of mapping.

Mapping Global Polio Eradication

World Polio Day is today, October 24, 2017.  It is a global effort to eliminate the last 0.1% of polio cases, and today we celebrate the progress over the past year. Blue Raster participates in the fight by supporting the World Health Organization’s (WHO) Global Polio Eradication Initiative.  We maintain WHO’s Polio Now interactive web map of polio cases and disease surveillance indicators.

WHO Polio Now web map

Pakistan, Afghanistan and Nigeria are the last three countries in the world that still have cases of wild poliovirus (WPV) transmission. The remaining cases are caused by circulating vaccine-derived polio (cVDPV2). This type of polio originates from the attenuated polio virus administered as an oral vaccine that has survived, mutated, and gets transmitted from person to person in under immunized populations.  This map captures the cases of WPV and cVDPV and also displays the surveillance efforts in each country.

To learn more about the successes of Global Polio Eradication Initiative over the past year and how you can support this effort, please visit their website at www.polioeradication.org.

Thirsting for a Future: UNICEF

Blue Raster collaborated with The United Nations Children’s Fund (UNICEF) to help produce Thirsting for a Future: Water and children in a changing climate. In a targeted study of Water, Sanitation and Hygiene using current climate and projected climate conditions, Blue Raster and UNICEF determined that by 2040, nearly 600 million children are projected to be living in areas of extremely high water stress. The report also highlights that increasing droughts and floods threaten quality and quantity of water.

As UNICEF puts it best: “No one suffers more from a change in climate than a child. Their small bodies are vulnerable to the changes in the air they breathe, the water they drink and the food they eat. For many children, a change in climate is felt through a change in water. In times of drought or flood, in areas where the sea level has risen or ice and snow have unseasonably melted, children are at risk, as the quality and quantity of water available to them is under threat. When disasters strike, they destroy or disrupt the water and sanitation services that children rely on.”

Blue Raster has (once again!) done an incredible job helping to conduct the analysis for this report. Their professionalism and technical sophistication continues to exceed expectations. In the face of incredible challenges now and in the decades to come, Blue Raster has helped us make the case for protecting children’s access to safe water and sanitation.

— Nicholas Rees, Policy Analysis Specialist, UNICEF New York

With Blue Raster’s help, UNICEF identified the children who are most vulnerable to the dangers of flooding and water stress. Geospatial analysis using ArcGIS Desktop helped to inform plans to mitigate current and future risk to children.


Page 4 of 9