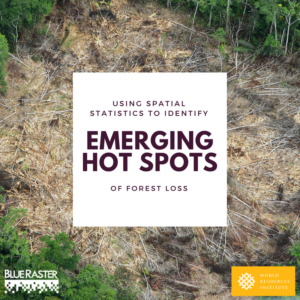
 Blue Raster is proud to have worked with the World Resources Institute (WRI) and the Esri Big Data Team to co-author the study, Using Spatial Statistics to Identify Emerging Hot Spots of Forest Loss.
Published in Environmental Research Letters, the study lays out the data-analysis workflow Blue Raster developed to identify trends in tree-cover loss in Brazil, Indonesia, and the Democratic Republic of Congo (DRC) between 2000 and 2014. Using Esri’s emerging hot spot analysis and big data analysis techniques, Blue Raster identified persistent, accelerating, and new hot spots of tree-cover loss, as well as cold spots of diminishing loss. New forest policies such as logging moratoria and incentives were linked with reduced forest clearing, whereas timber harvesting, road-building, and agricultural land clearing were associated with hot spots.
Techniques identified in the study will help decision makers, technical experts and the broader public better understand trends in deforestation and improve forest monitoring going forward. While the article focuses on Brazil, Indonesia, and the DRC, the methodology can be scaled for larger or smaller regions, as well as for different windows in time.
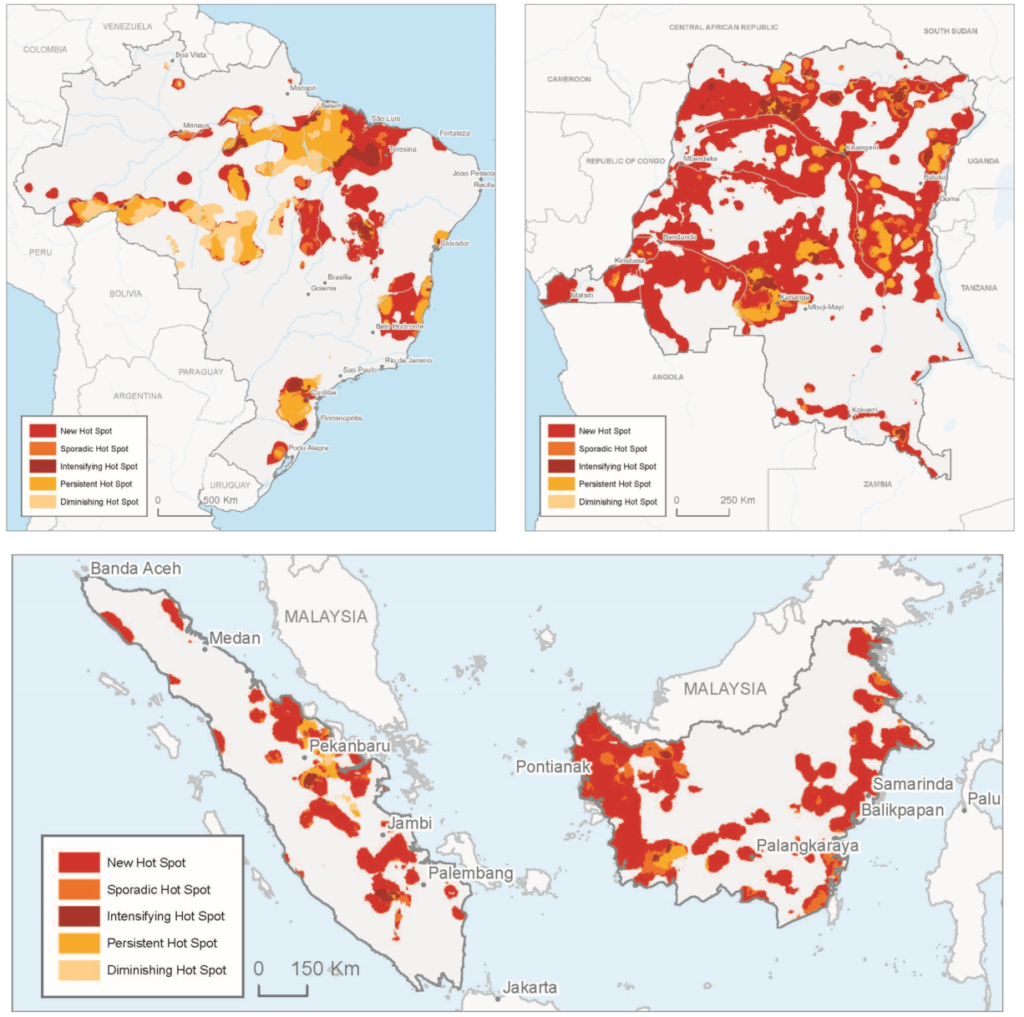
Accompanying the paper, Blue Raster produced maps of intensifying, sporadic, and new hot spots of deforestation for each area of interest. The visuals indicate a broad range of trends including:
- Shifting spatiotemporal patterns of loss in Brazil, with forest loss significantly diminishing within the Amazonian states of Mato Grosso and Rondônia and intensifying within the cerrado biome;
- New and statistically significant hot spots of forest loss in 2013 and 2014 in West Kalimanta, Indonesia; and
- The emergence of vast areas of DRC as significant new hot spots of forest loss, with intensified loss radiating out from city centers such as Beni and Kisangani.
The release of the article coincides with the World Economic Forum, an event where 20 of the world’s largest commodity producers, traders, manufacturers, consultants, and retailers launched a new partnership with research institutions and banks to monitor deforestation and manage sustainability from farm to customer. The partnership, led by WRI’s Global Forest Watch team, will focus on building an online global decision-support tool that builds on the GFW Commodities platform to increase transparency and traceability across supply chains.
Read the full publication by WRI, Blue Raster, and Esri online at IOP Science.
 On November 16th, we celebrated

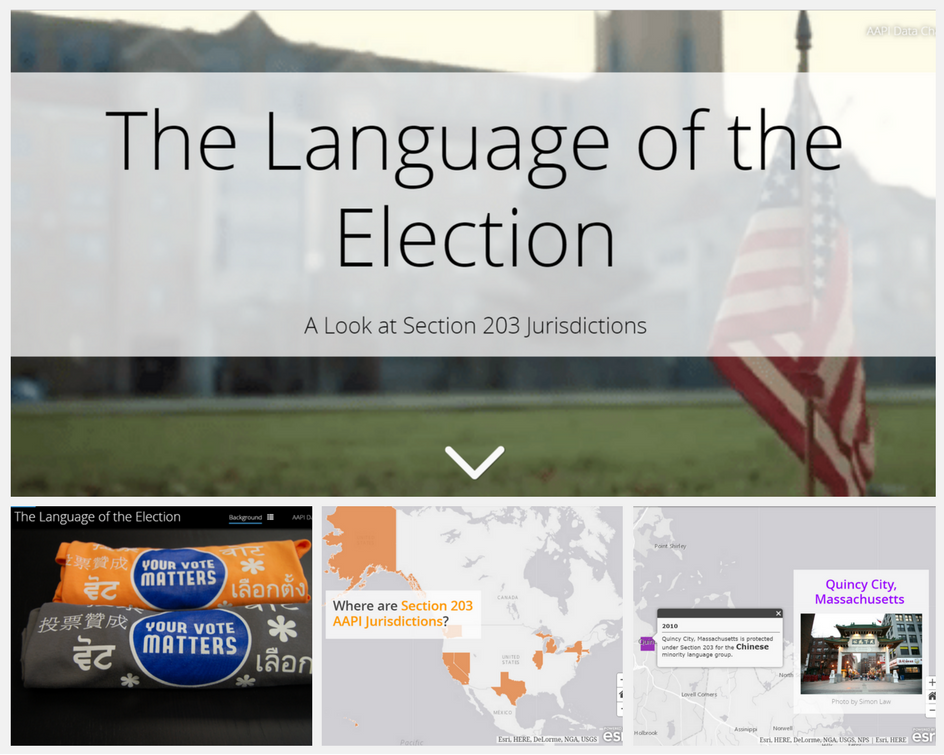
 “Every vote matters, and language should not be a barrier to participation. Our