Story Map

Blue Raster Wins Esri’s StoryMap Challenge


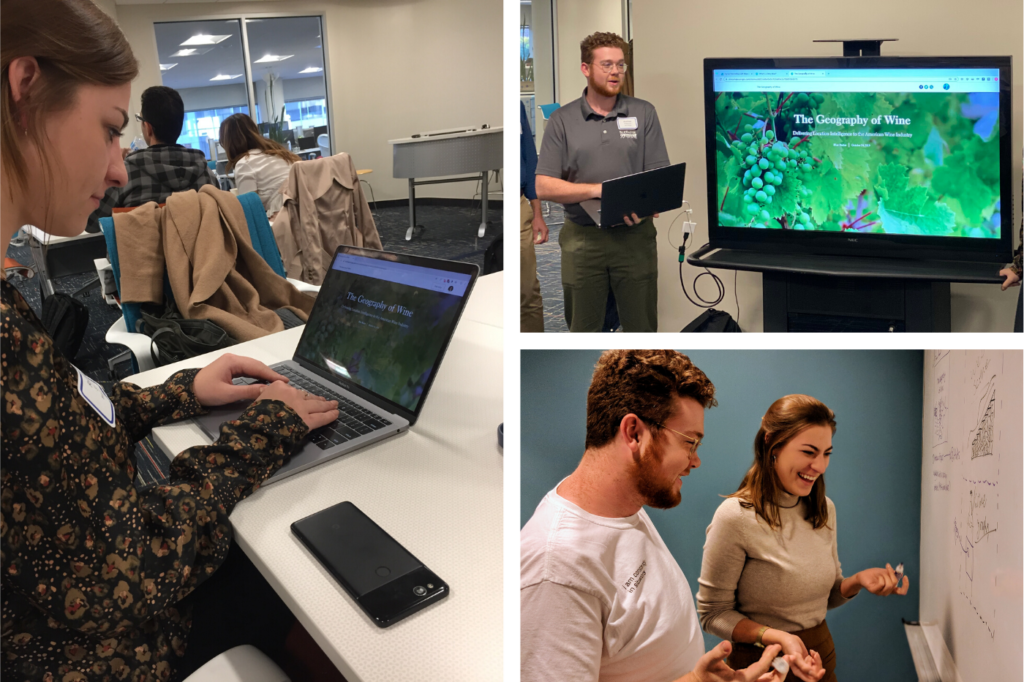
Last week, Blue Raster attended and presented at the Esri Federal Business Partner StoryMaps Challenge and Open House at the Esri R&D office in Arlington, Virginia. Two of our team members, Rachel Stock and Andrew Patterson, visited the R&D center for the day long competition. Our StoryMap about mapping America's wine regions was selected as the winner. This provided our team a chance to present about the making of the StoryMap at the Esri Open House.

Behind-the-scenes look at producing the StoryMap:
Making of the StoryMap pictures

The Geography of Wine focuses on Blue Raster's work digitizing over 270 American Viticulture Areas (AVAs) for the Alcohol and Tobacco Tax and Trade Bureau (TTB). In addition to this work, we made the maps explorable to the public through the AVA Map Explorer application. The app allows users to view current and proposed AVAs, as well as submit proposals for brand-new AVAs.

StoryMap photo of a vineyard

Blue Raster’s story map about our TTB work highlights the importance of AVAs and features some of the most geographically unique AVAs from around the country. Additionally, it points out that, with GIS, we can provide location intelligence to the American Wine Industry.

View the winning StoryMap about mapping America’s wine regions, and learn more about our TTB work and creation of the AVA Map Explorer.

Using StoryMaps to Celebrate Arlington County’s 1920 Centennial

Up until the end of the American Civil War, both present-day Arlington County and Alexandria County were included under the Alexandria County name. Then, in 1870, Virginia's re-written Constitution called for the state’s many incorporated cities to become independent from their respective counties. Thus, Alexandria City separated from the County of Alexandria, which was renamed to “Arlington County” to avoid confusion.

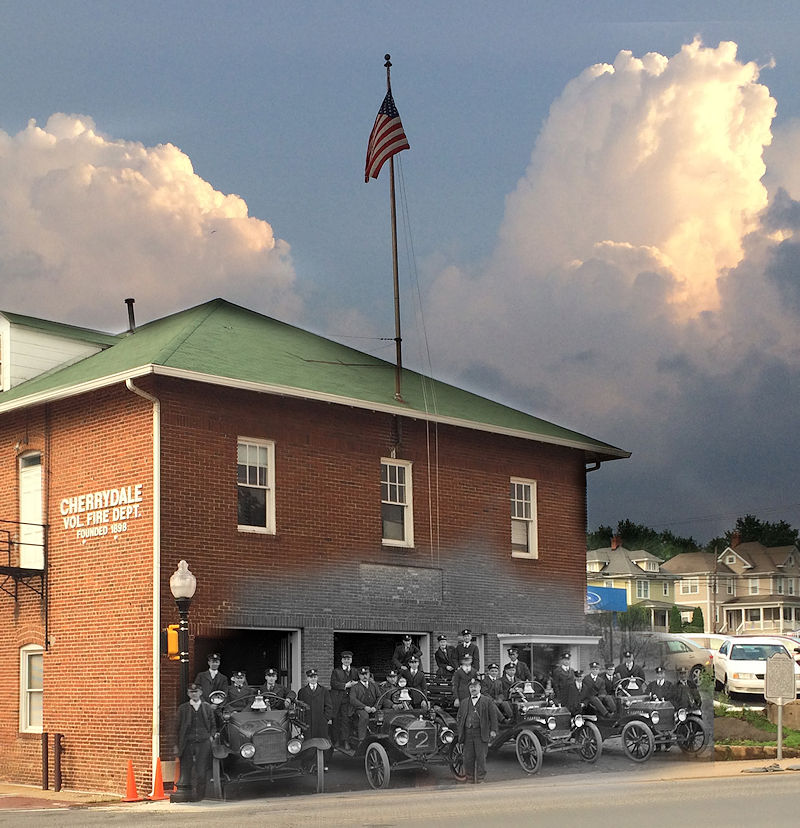
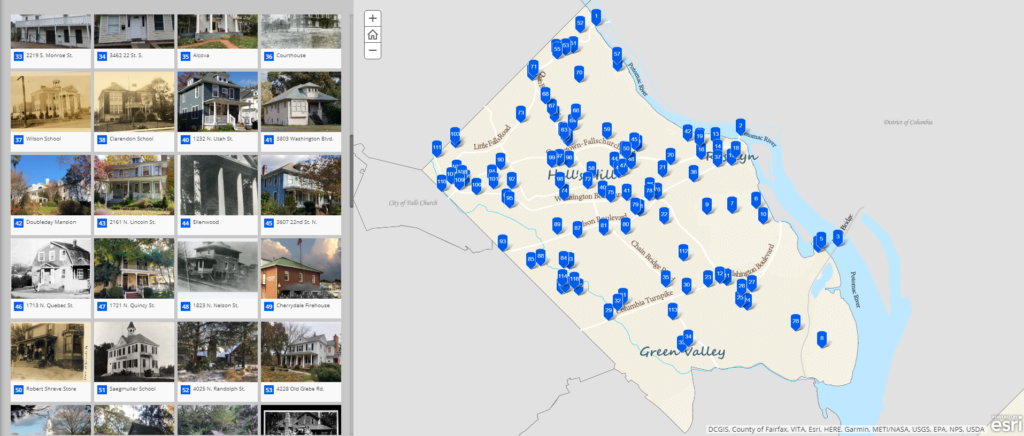
Blue Raster partnered with the Arlington Historical Society to create a StoryMap celebrating Arlington County's centennial anniversary. This StoryMap highlights 115 points of historical significance throughout the county, as curated by the Arlington Historical Society. The map displays a diverse range of feature types, including bridges, farmhouses, mansions, schools, and more. Each location also features a high-quality picture, modern-day address, and informative site description.

Arlington Centennial StoryMap

Arlington County Centennial StoryMap

This StoryMap also features a custom basemap, created from scratch by Blue Raster’s GIS and design teams. This basemap gives viewers a better view of what Arlington County looked like in 1920, including historic street and community names. In addition to a view of the past, this basemap also contains elements of the present. Zooming in activates a layer showing current-day building footprints that can help the viewer relate present locations to historical points of interest.

Since our inception in 2002, Blue Raster has been headquartered in Arlington County, Virginia. We always love working with local businesses and organizations, and we look forward to celebrating the county’s centennial anniversary with this StoryMap.

Let Blue Raster create your organization’s next StoryMap. Contact us today to get started!

Contact Us

  • This field is for validation purposes and should be left unchanged.

Highlighting Jane Goodall’s Conservation Approach with a New Story Map

ENGAGE - LISTEN - UNDERSTAND - ACT

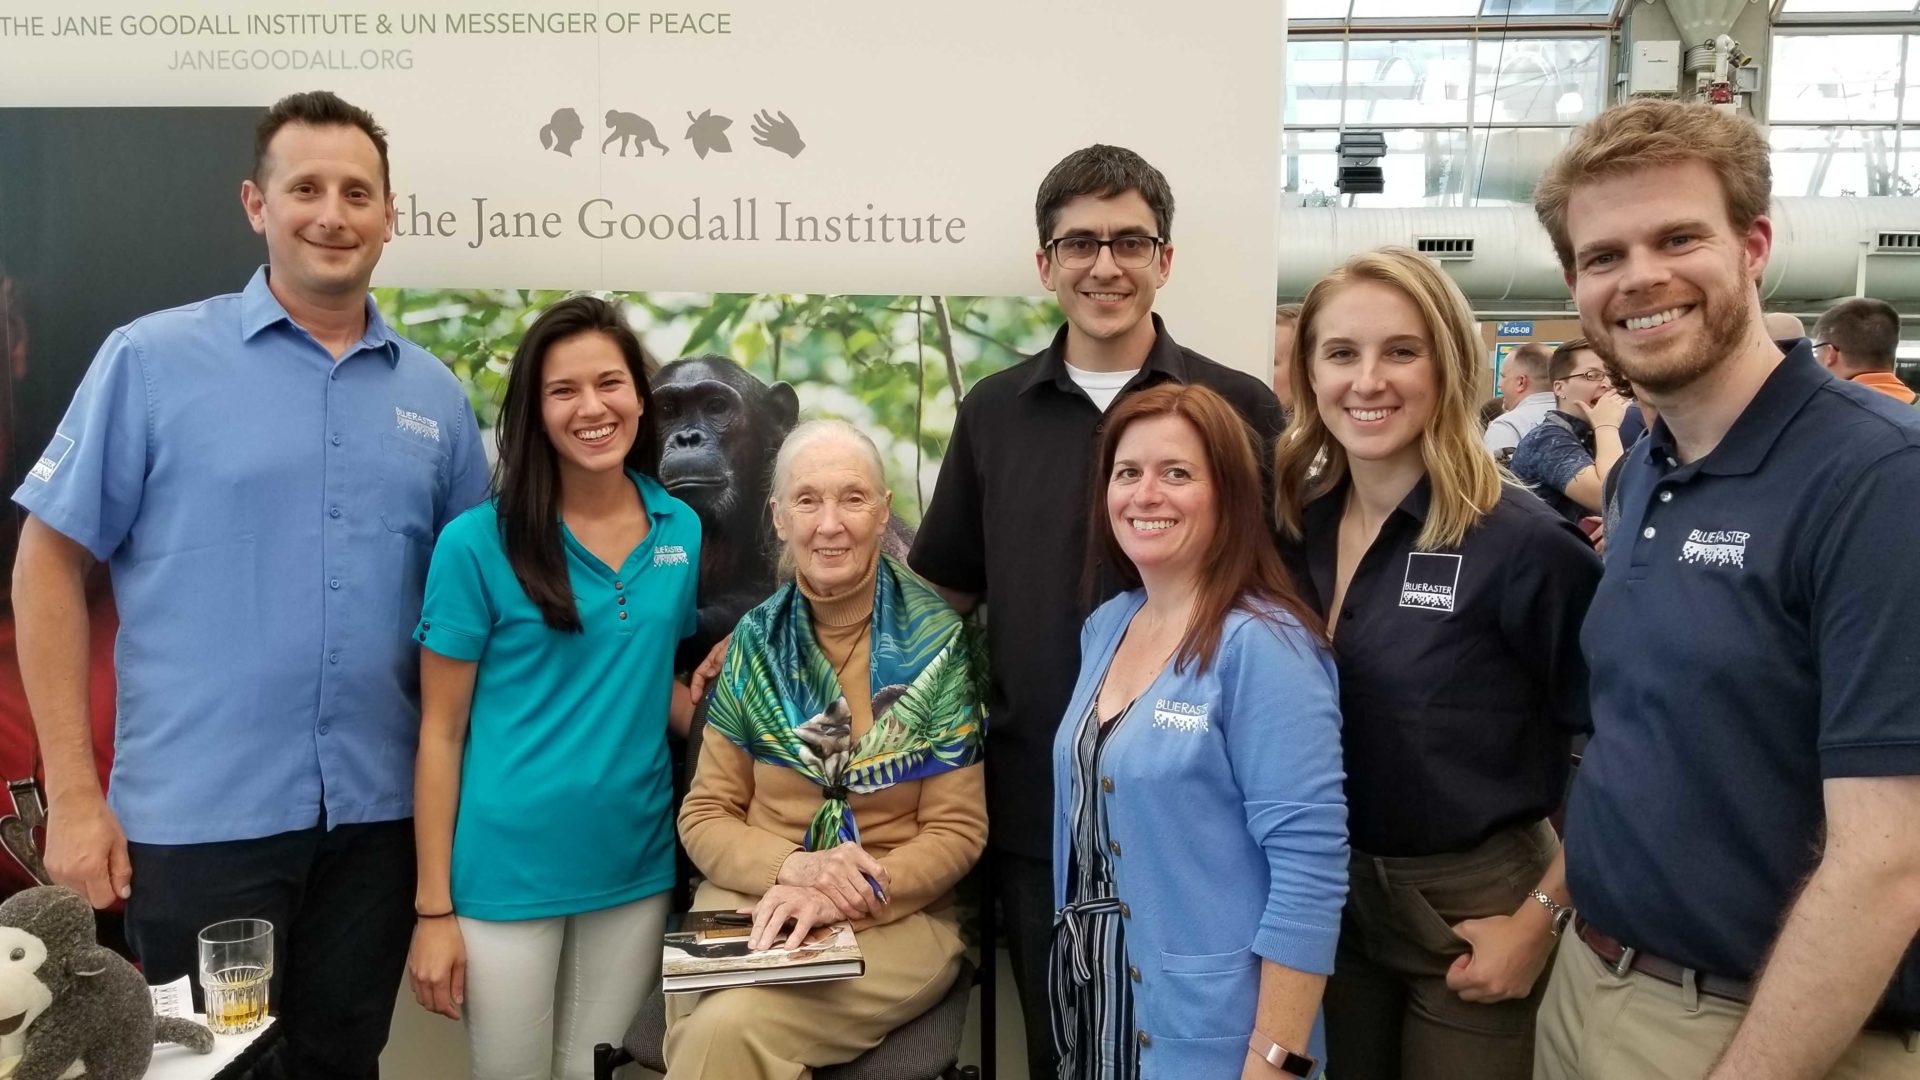
Timed to coincide with Dr. Jane Goodall’s plenary speech at the 2019 Esri User Conference in San Diego, California, Blue Raster, Esri and the Jane Goodall Institute teamed up on an exciting new Story Map.

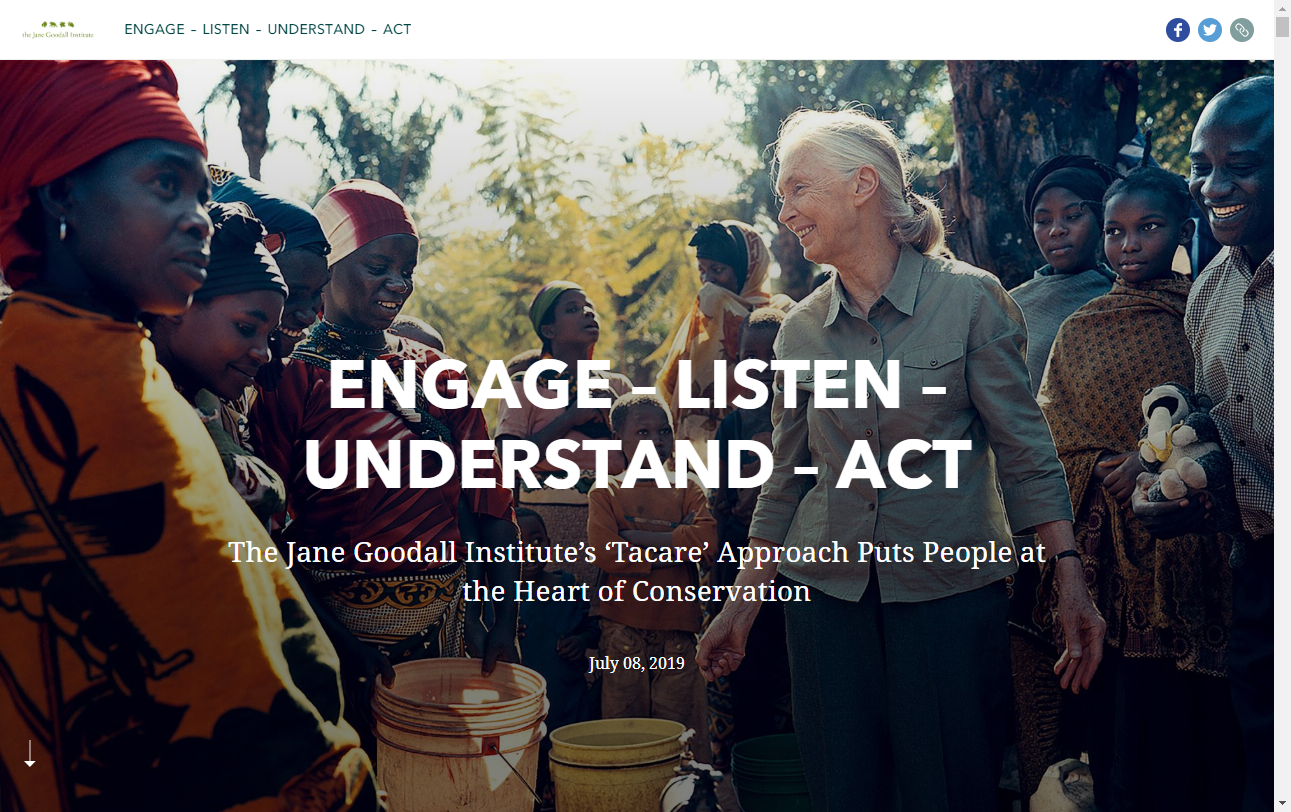
ENGAGE – LISTEN – UNDERSTAND – ACT, built with the brand new ArcGIS StoryMaps template, tells the story behind the ‘Tacare’ approach toward conservation. The story map outlines concerns over chimpanzee populations and the environment, the steps in the process of Tacare, and success stories with this conservation approach.

Beginning with an overview of how Jane Goodall first became involved with conservation through her work with chimpanzees, the story unfolds as Jane noticed that much of the forests in Western Tanzania, home to her beloved chimpanzees, had become barren hillsides after years of farming and other human related activities in the area. She realized that the only way to conserve chimpanzees and their habitat was to work directly with local people and communities. The story map we created titled, Engage - Listen - Understand - Act, explains this holistic approach and some of the successes the area has already seen through the work of Tacare.

Blue Raster is honored to have had the opportunity to help create the first dedicated web presence that details the Jane Goodall Institute's Tacare conservation approach and is especially thrilled to have been able to use the latest version of the next-gen StoryMaps builder.

An all-star team, including master storyteller Allen Carroll from Esri and Lilian Pintea, VP of Conservation Science at the Jane Goodall Institute, worked in collaboration with Blue Raster to produce ENGAGE – LISTEN – UNDERSTAND – ACT.

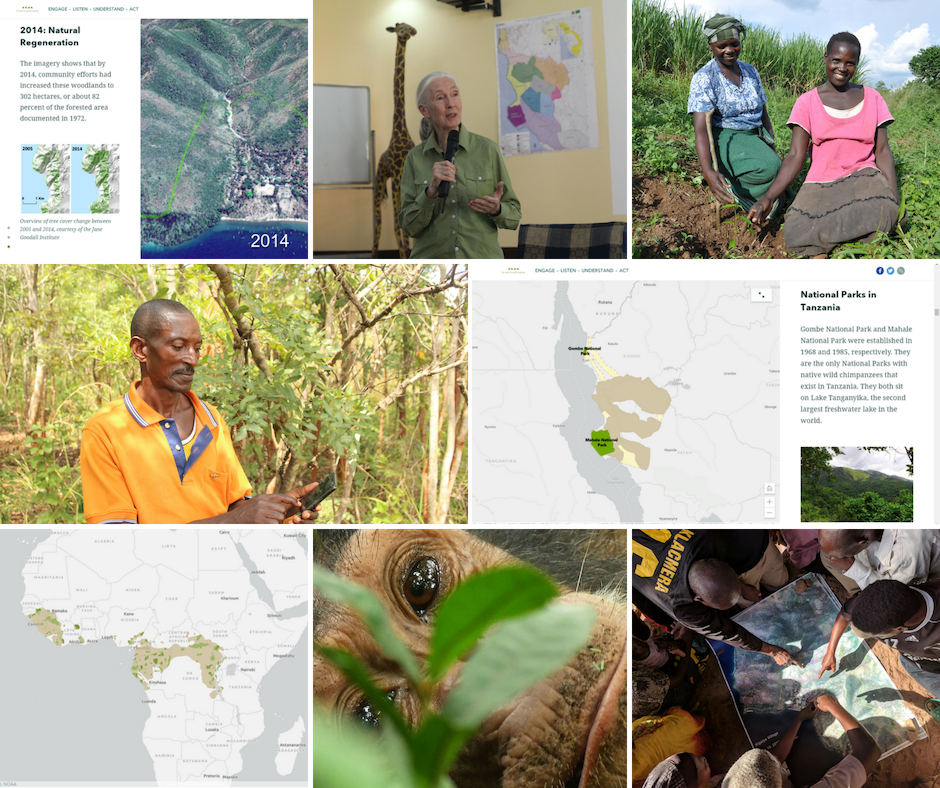
The new Story Map builder helps the reader flow seamlessly through the story of Tacare; the application intersperses captivating photos taken on the ground in Tanzania and interactive mapping elements that display chimpanzee ranges across Western Tanzania and the African continent. Success with Tacare can be seen in "before" and "after" aerial imagery, which helps readers to visualize the reforestation occurring in the area.

Jane Goodall photos

Not only does this story map detail the incredible conservation efforts led by the Jane Goodall Institute but it also serves as a call-to-action for other conservation efforts and organizations around the world. Conservation is in the hands of local people - by understanding the needs of local communities, we are then able to help create a sustainable future for our world.

BR_JGI

This story map will be displayed at the Esri UC Conference. If you're attending, make sure to check out Blue Raster's booth!

For more info about our work with the Jane Goodall Institute, read our blog post about our dashboard project in Tanzania.

The Magic of Maps: Presenting Esri StoryMap Beta

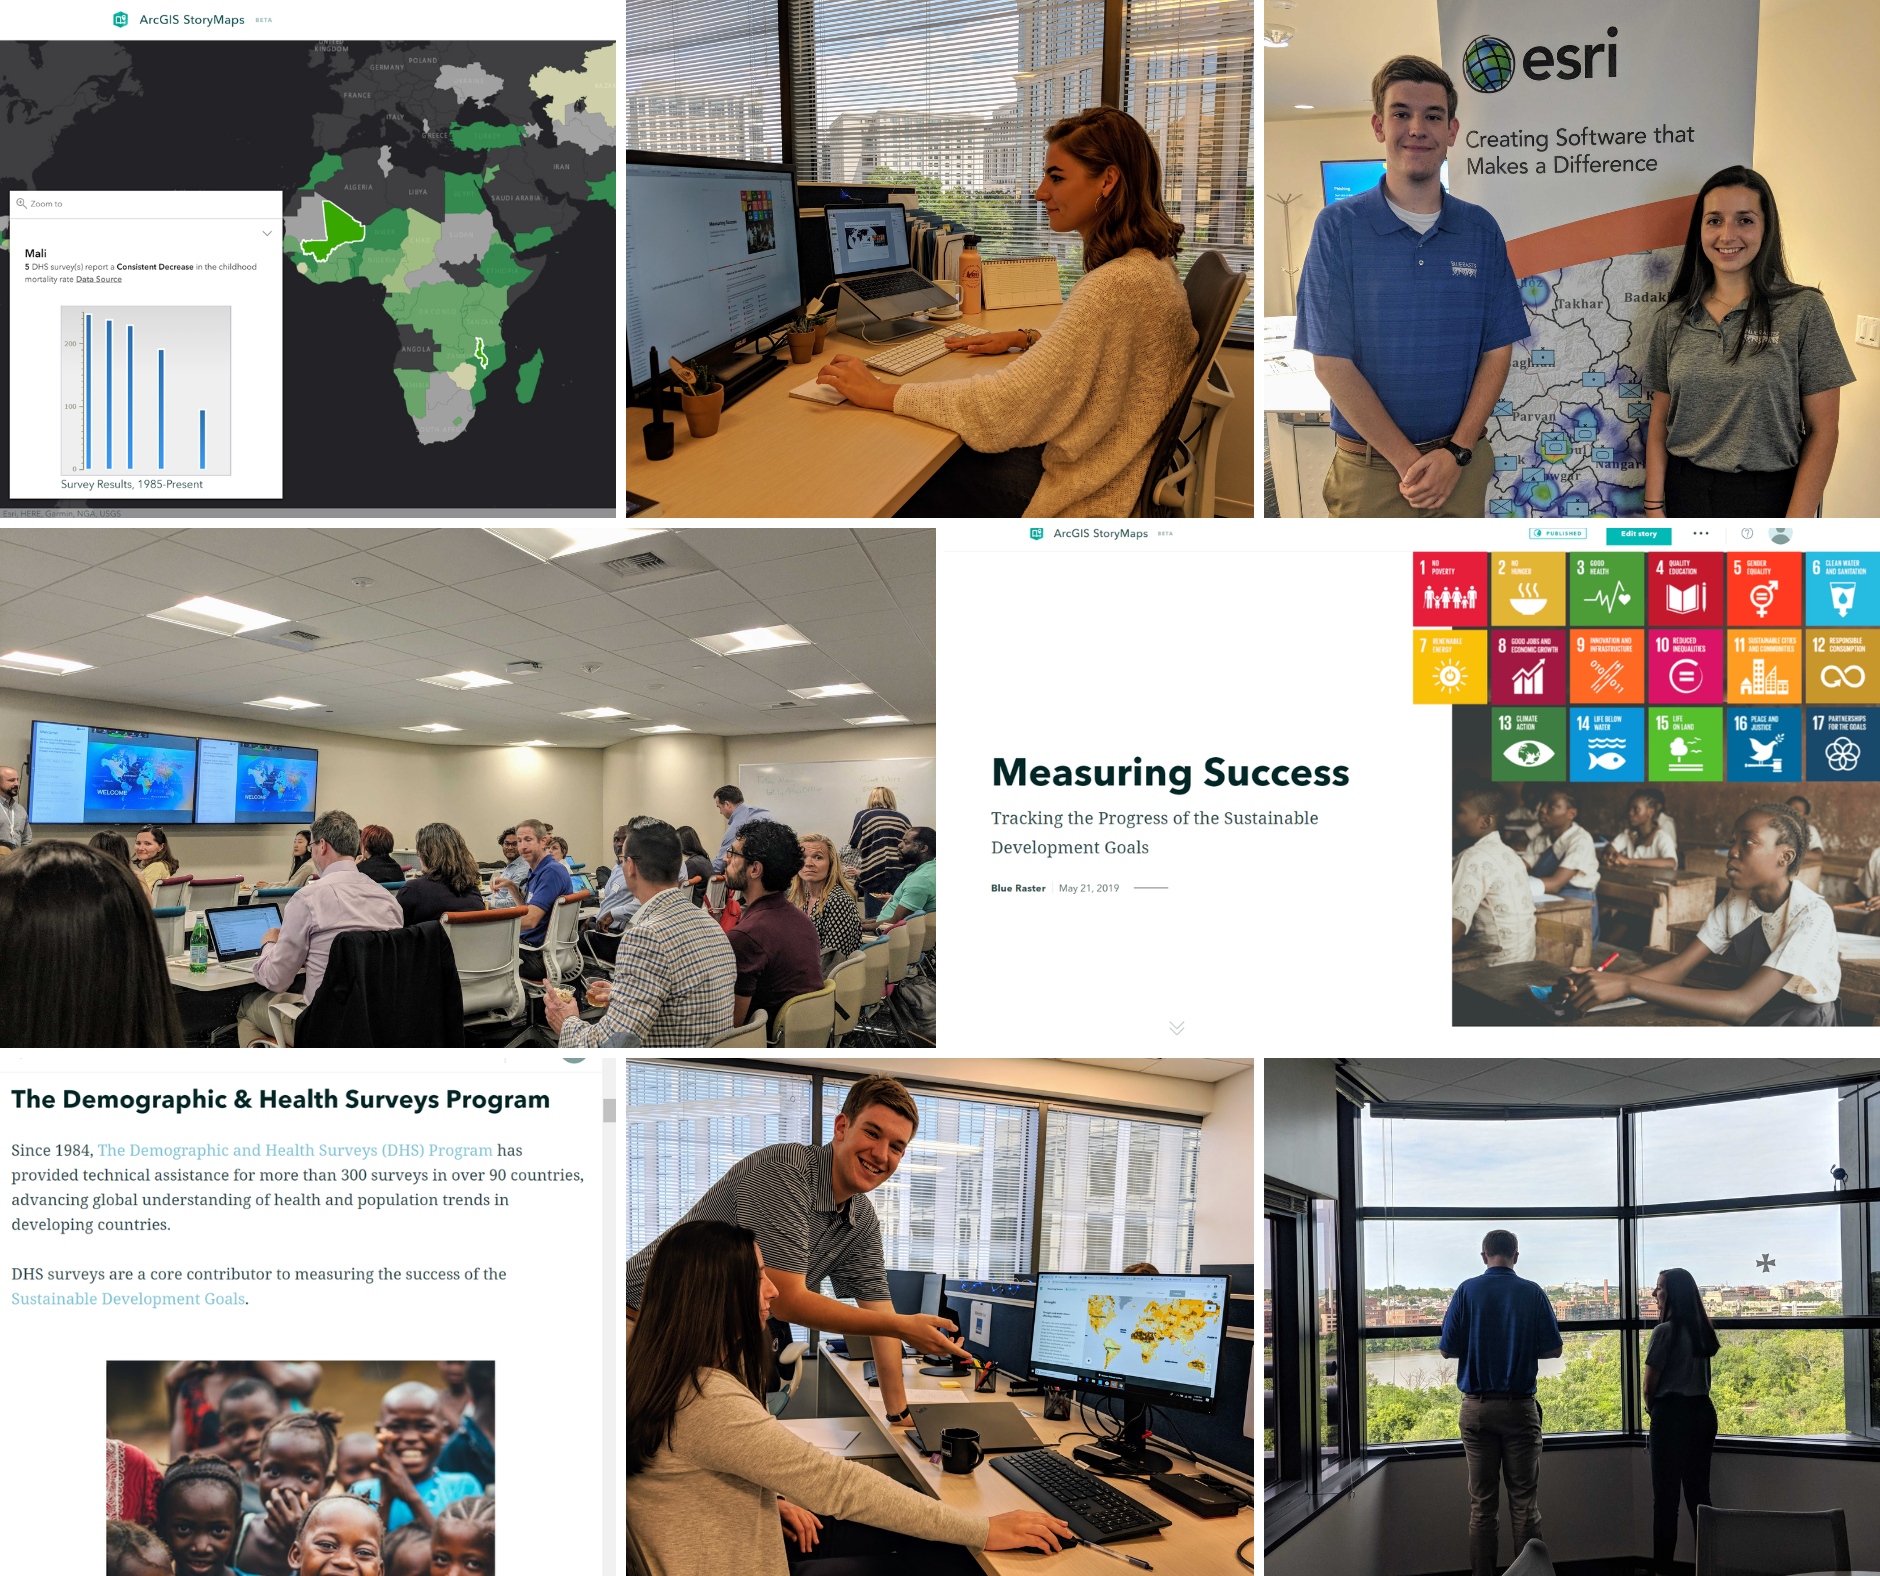
Blue Raster recently had the opportunity to create and present a StoryMap using the new ArcGIS StoryMaps (currently in Beta) for Esri’s “The Magic of Maps: How to Engage and Inspire Your Community” event. At this event, we were able to introduce our own thoughts on the new platform, as well as give advice on how organizations are able to utilize these tools successfully. The StoryMap itself, titled Measuring Success, goes into detail on how some of Blue Raster’s nonprofit partners are tracking progress of the United Nations’ Sustainable Development Goals. It addresses five of the seventeen SDGs and encompasses the work of The Demographic and Health Surveys Program, UNICEF, and The Nature Conservancy.


The Magic of Maps

The Magic of Maps

The presentation focused heavily on how organizations can be successful in the creation and utilization of their StoryMaps, including knowing the target audience, recognizing the potential of a successful StoryMap, and creating a concise and engaging design. Additionally we were able to showcase the features included in the new beta version of ArcGIS StoryMaps. With the new, modern platform users are able to pick and choose distinct elements to piece together, rather than having to select a set template. Uniform text and font size options also help to eliminate the complexity of styles and reduce design workload. Dynamic media types such as maps, videos, and images can be seamlessly integrated into a number of StoryMap features to further engage the audience. Most importantly, the new builder has a simplistic user interface that allows anyone regardless of prior experience (or lack thereof) to produce a professional-caliber StoryMap.

Special thanks to the members of the Blue Raster team who collaborated to create and present this StoryMap: Project Manager Christina Phang, UI/UX Designer Rachel Stock, GIS Intern Kelly Motzko, and GIS Intern Joe Nadonley.

You can view the slides and listen to the presentation here.

Following the Student Journey: Education to the Workforce

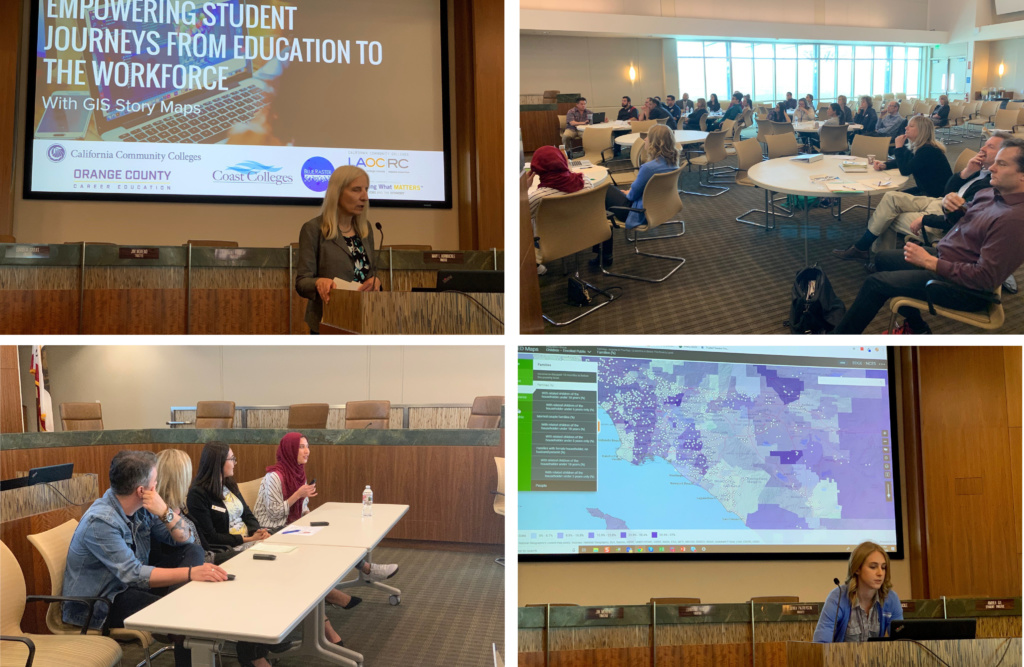
The TalentED Story Map brings community college students to the forefront of job opportunity and workforce development. In California, Blue Raster, the Community Coast College District (CCCD) and LearningCurved presented a hands-on workshop exploring the use of geographic maps as a tool to transform career exploration. Additionally, the team presented ways to use Geographic Information Systems (GIS) Mapping for story telling, decision making, and collaboration.

The workshop brought together over 35 attendees from local community colleges and industries, each with unique experience working directly with students and the platform. Attendees explored topics such as:

    • Maps for Smart Decision Making
    • Effective Use of Story Maps
    • TalentED Demonstration
    • User Feedback & Panel Discussion

The TalentED platform provides interactive career exploration by focusing on key concepts which are important to students. Priority Industry Sectors introduce nine growing industries in Southern California, for example Biotechnology and Advanced Transportation. Dig into each Industry Sector to learn more about occupations and wages. In addition, students can explore companies that have careers in those industries and hear testimonials from professionals who followed a similar path.

Community Feedback

The TalentED Development Team worked vigorously to get student feedback and understand ways to improve the platform. For example, the Development team conducted a Pilot Program Survey, where 595 Students and Staff from nine different colleges were invited to get a first look at TalentED. Participants had the opportunity to provide an evaluation of the platform and reflect on their experience navigating the platform. Further, the participants helped us understand if they thought the platform was effective in career exploration and if it was something they would share with their peers. As a result, the TalentED team can hone in ways to make a more effective platform for the students. The positive feedback from the users was tremendous and several respondents spoke directly about their experience at the workshop. Watch the feedback given by users through personal testimonials below.


Page 3 of 9