Water

Mekong Infrastructure Tracker

Home to more than 300 million people and some of the most endangered wildlife on the planet, the Greater Mekong region in Southeast Asia is the second most naturally diverse place in the world, second only to the Amazon. This region is also home to the Mekong River which not only sustains much of the wildlife in the area, but also the people. The majority of the population in this region is dependent on the river and its surrounding wetlands to support their way of life. In turn this also means that this population and the vast biodiversity in the region are extremely vulnerable to the economic and environmental outcomes of growing infrastructure.

Mekong River

As one of the nation’s leading think tanks dedicated to building solutions to promote international security, prosperity, and justice, the Stimson Center is working to address the environmental and social impacts along the Mekong river to improve food security, stability and cross-country relations. To help analyze these issues, Blue Raster collaborated with the Stimson Center to create The Mekong Infrastructure Tracker, an interactive Web App to explore the infrastructure boom and its impacts in the Mekong region. With funding provided by USAID, the Mekong Infrastructure Tracker was developed with support from the USAID Mekong Safeguards activity led by The Asia Foundation.

Mekong Infrastructure Tracker

The Mekong Infrastructure Tracker

The Mekong Infrastructure Tracker web app leverages ArcGIS Online and the ESRI JavaScript API and provides users with data transparency to analyze the type and scale of different infrastructure projects in the region in relation to socioeconomic and environmental factors.

The tracker contains two dashboards, one showing power generation projects and the other showing road, rail, and waterway infrastructure projects. The data in the tracker visualizes projects by type in combination with data showing threatened species, earthquakes over the last twenty years, armed conflict, ethnicity, watersheds and tributaries that can all be turned on and off depending on user preference.

Additionally, users can filter the projects by a variety of statuses: year of completion, project size, sponsoring country, project type, country, or watershed.

Mekong Infrastructure Tracker filter

From these filters, the tracker produces a series of charts and graphs to better visualize some of the statistics surrounding these projects which can then be downloaded based on user needs.

The Mekong Infrastructure Tracker allows for transparency of the infrastructural impact on this region, both protecting the diverse and endangered wildlife as well as the livelihoods of millions of people. Explore this new tool today!

India Water Tool Helps Turn Water Risks to Water Solutions

Blue Raster is pleased to have partnered again with the World Business Council for Sustainable Development (WBCSD) on the third version of the India Water Tool. As much of India faces high to extremely high water stress, it is one of the most water-stressed countries in the world.

The India Water Tool helps users understand their water risks and plan interventions for water management in India. With over 20 datasets and risk indicators from the Government of India and other institutions, the tool helps companies understand water risks for their operations and supply chains. For investors, the tool can help with site selection and investment for new locations. Additionally, users have the ability to input or upload facility-level information and view:

          • Maps of water availability, quality and stress
          • Charts and graphs of current and historic water availability and quality
          • Summary reports of water data for their locations

India Water Tool

India Water Tool

India Water Tool

India Water Tool


Design

The Blue Raster design team completely updated the visual identity of the tool, including the color schemes, fonts and icons. Blue Raster’s developers then implemented the design in collaboration with other WBCSD partners. Check out and explore the India Water Tool 3.0 today.

“The tool is an important step towards water management in India. The nationwide analysis it provides allows for a good understanding of local water situations and helps build comprehensive corporate water management strategies and stewardship approaches.

The country needs action at the scale of a movement to help it manage the water stress situation. Bringing granular data on an open access and easy to use platform is an important step in driving such coordinated action. Blue Raster has done a commendable job in making this national tool a great looking and easy to use platform”.

– Deepa Maggo, Manager – Water at the World Business Council for Sustainable Development

A Summer at Blue Raster: Internship Edition

As a summer intern at Blue Raster, I was given the opportunity to contribute to a multitude of projects. I was able to explore customizations of basemaps and manipulation of satellite data, work hands-on with 3D buildings in ArcGIS Pro, and contribute to a variety of other GIS work. The internship provided a great learning experience.

One such project, in conjunction with MIT Media Lab’s Space Enabled Research Group, aimed to track the growth and spread of aquatic surface vegetation. Focused on the Lake Nokoue region of Benin in West Africa, the goal of the collaborative project was to create a method of identifying the growth of water hyacinth in the lake and its tributary rivers for remediation purposes.

Internship work on GEE Lake Nokoue

I, along with several interns at Space Enabled, used Google Earth Engine (GEE), which provides immense processing power using Google’s server infrastructure, to access and manipulate several satellite data sources such as Landsat8 and Sentinel2. With additional support from the Blue Raster team, we were able to create a script for GEE’s Python API that scanned for changes in reflectance in Landsat8 and Sentinel2 and helps to track growth trends of the water hyacinth for future ground truthing trips by the MIT Media Lab Space Enabled team. We are exploring the use of Esri ArcGIS ImageServer for analysis for future work in this space.

Intern work on GEE classification

Throughout the summer internship, I also had the opportunity to work extensively with 3D data in ArcGIS Pro. In our work supporting a global Commercial Real Estate firm, we innovated with 3D to deliver a new suite of tools. Using a special data package created by Esri for City/Local Government GIS, I was able to create stacking plans of building floors to be implemented as a 3D layer along with full 3D models of the corresponding buildings in an ArcGIS Online Webscene.

Internship work on Floor stackingInternship work on 3D Buildings

During the summer internship, I learned a tremendous amount about ArcGIS Pro and 3D data. The opportunity to learn the functionalities and intricacies of ArcGIS Pro, particularly in a real-world setting, is not something offered through my university coursework. Working interactively with Blue Raster to troubleshoot and solve 3D issues in a quick paced environment provided valuable insight.

Overall, my time as an Intern at Blue Raster and the lessons I have taken away have helped to further my understanding of what a possible career in GIS has to offer. I feel that the projects I was able to contribute to will have a genuine impact. Having the opportunity to assist in their creation was an experience that will last a lifetime. I am excited to continue supporting Blue Raster as I return to Penn State.
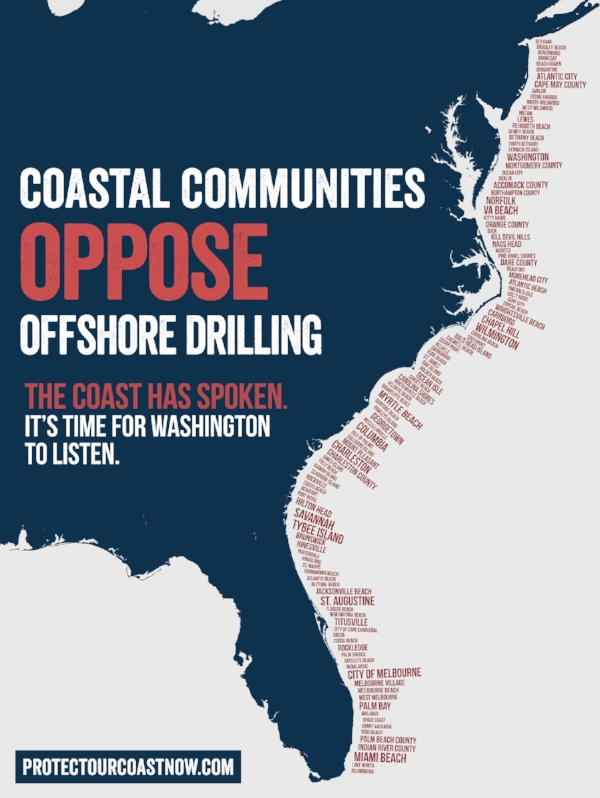
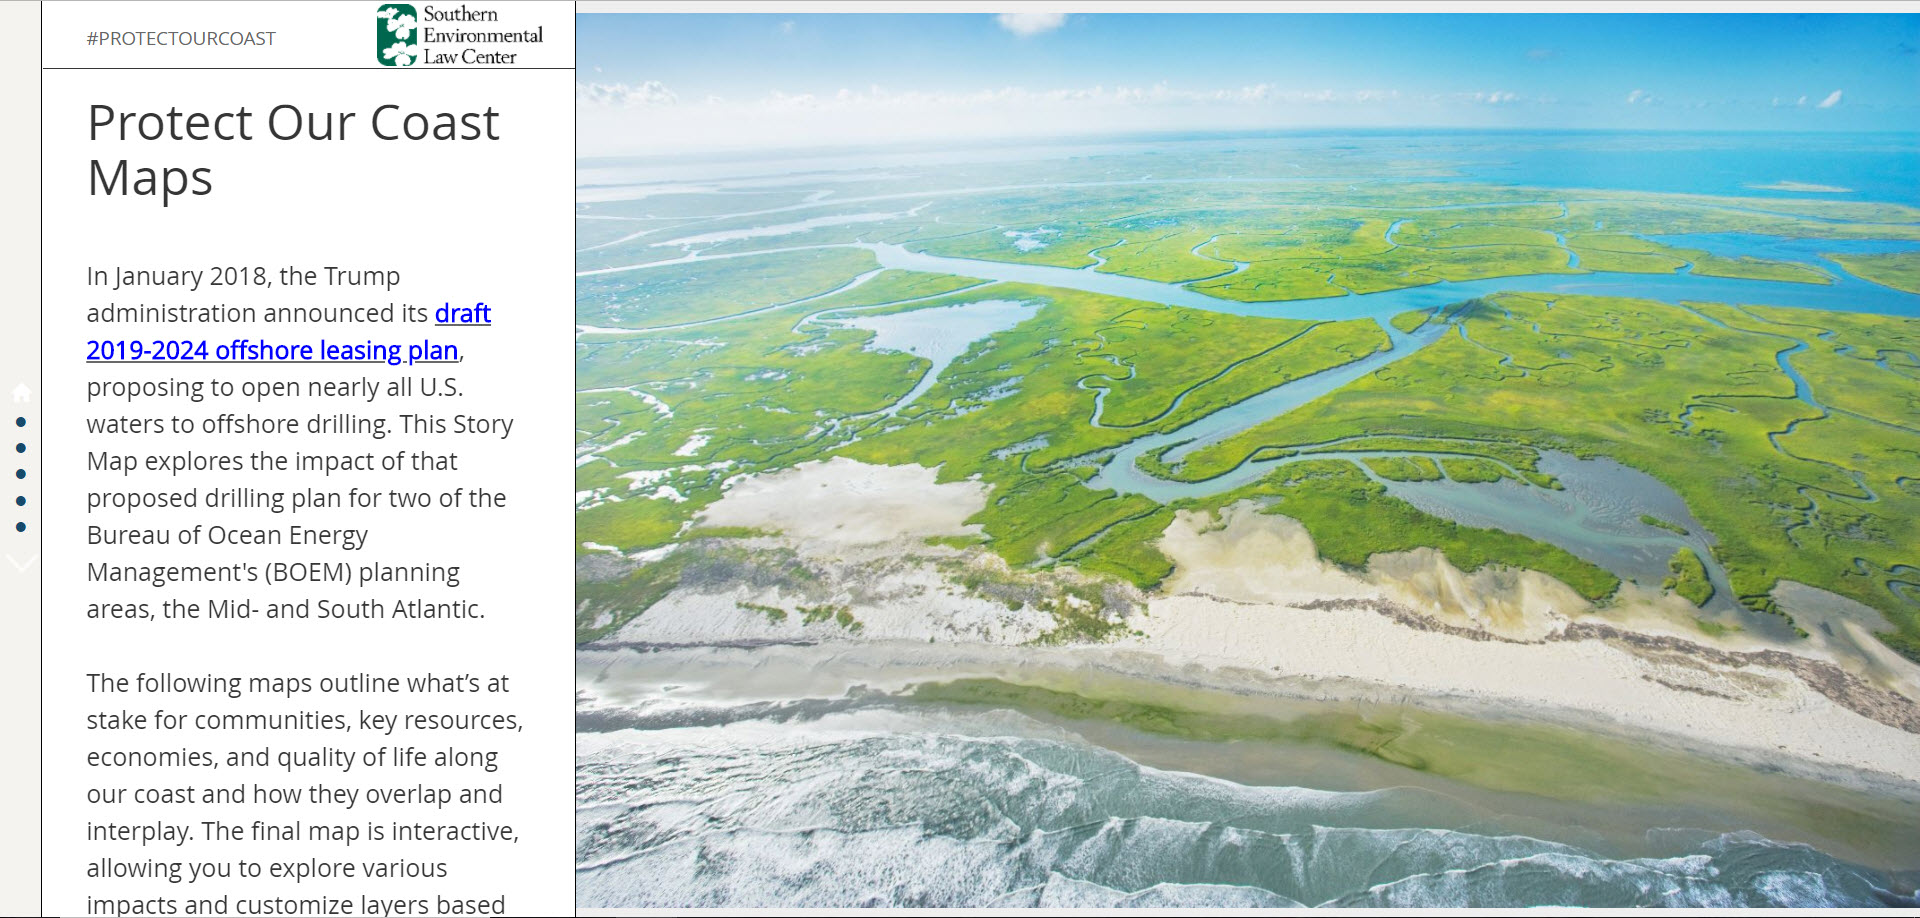
Story Map Delivers #ProtectOurCoast Campaign

In January 2018, the White House proposed opening nearly all U.S. waters to offshore drilling. On the East Coast, governors are speaking out with concerns about the risks offshore drilling would pose to the coastal environment, economy, tourism, and quality of life. Out of 22 U.S. coastal states, 15 governors stated opposition to drilling. Additionally, over 140 local communities along the Atlantic Coast have passed resolutions opposing offshore drilling, seismic testing, or both.

The Southern Environmental Law Center (SELC) launched a public messaging campaign to elevate the voices of local communities opposed to offshore drilling when the previous administration released its proposed drilling plan in 2015, and has continued these efforts in light of the current administration’s plan to reopen the possibility of drilling in the Atlantic. Working in six states throughout the Southeast, SELC has over 70 attorneys and nine offices dedicated to clean water, healthy air, mountains and forests, and coastal protection. A nonprofit organization, they work at all levels of government and with all three branches to strengthen laws, hold government accountable and stop environmental abusers.

For the #ProtectOurCoast campaign, SELC worked with Blue Raster to develop a Story Map outlining the major concerns of offshore drilling in their region. SELC was interested in creating an interactive story-telling tool to better inform communities about the threats of offshore drilling and to drive public comments to the Bureau of Ocean Energy Management (BOEM). The Story Map highlights state and local opposition, incompatibility with existing military training areas, impacts of drilling infrastructure, and threats to coastal economies. SELC also draws attention to the region’s abundance of natural resources, including habitat for species like the critically endangered North Atlantic Right Whale, dozens of National Wildlife Refuges, National Seashores, state protected areas and ecologically important marine areas, where a single oil spill would devastate the healthy waters and clean beaches that are critical to wildlife and coastal communities.

Learn more about the risks of Offshore Drilling at the campaign page and Story Map!


Working with Blue Raster has allowed SELC to provide users with the ability to learn the core concerns of opening the Atlantic coast to offshore drilling, and the power to interact with the data on their own terms. The assemblage of marine and coastal ecological data, compatibility of military operations, industrial footprints, and community opposition created a set of stories, difficult to communicate through print maps alone. Blue Raster helped SELC transform an ArcGIS Desktop workflow into a multi-faceted geospatial tool with Web App Builder, Story Map Templates and ArcGIS Online. The result-an interactive, engaging experience for users to explore the impacts of the proposed drilling plan by showing what’s at stake for communities, environmental resources, economies, and quality of life along our coast, and how these factors overlap and interplay.

Jovian Sackett, Senior Geospatial Analyst, Southern Environmental Law Center 

GIS for Community Engagement with the World Bank

With over 2,000 projects benefiting 3.5 million people, the Azerbaijan Rural Invest Project (AzRIP) launched by the World Bank has been extremely successful in advancing the lives of everyday people by improving infrastructure in rural areas. Since its launch in 2005, the World Bank has assisted in a variety of projects including improving road conditions, health clinics and schools, and access to clean water. With so many projects across the 56 Rayons of Azerbaijan, Blue Raster was eager to help them create a map that had two goals: provide the Azerbaijani citizens a window into AzRIP's activities within the community and help investment teams make more focused, data-driven decisions.

A Commitment to Success

The World Bank has a commitment to success: each project works towards eradicating extreme poverty and promoting shared prosperity. The development of this web application is crucial to increase the community engagement of those benefiting from the investments, and we need to know what works when it comes to impacting everyday lives.

The application allows users to easily search by the type of investment project, with symbology that immediately translates the spread of certain types of investment projects and how these exist within communities and across borders. Also important was the ability to search by Rayon, year, and number of beneficiaries, to help understand the progression of these projects over time.

The Right Product

Because the projects are continuously evolving, Blue Raster worked with the World Bank to find a GIS solution providing organizational access to and ongoing management of the map. The Map is built utilizing ArcGIS Online, a complete, cloud-based mapping program that delivers these institutional requirements.  ArcGIS API for JavaScript provides the web framework for robust data visualization and data editing.

Throughout the development and launch of the application, Blue Raster assisted with international launch events attended by top government officials and stakeholders.  We love to meet the people who can use the application in their everyday lives and show them the power of mapping.


Page 3 of 7