Our Work

Blue Raster helps you tell your story through interactive
mapping technology. Make your message clear, exciting,
and user-friendly for both mobile and web platforms.

APTA

Improving the APTA Industry Footprint

We are very proud to announce that we are in our fourth year of supporting the American Public Transportation Association’s (APTA) Industry Footprint.  The APTA Industry Footprint is a public transportation industry map application that supports APTA’s mission of strengthening and improving public transportation through information sharing. Public transportation provides personal mobility, reduces traffic congestion, reduces our carbon footprint, and provides economic growth opportunities.

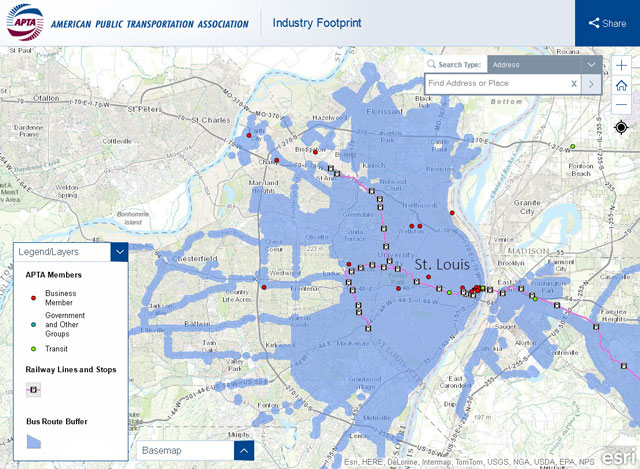
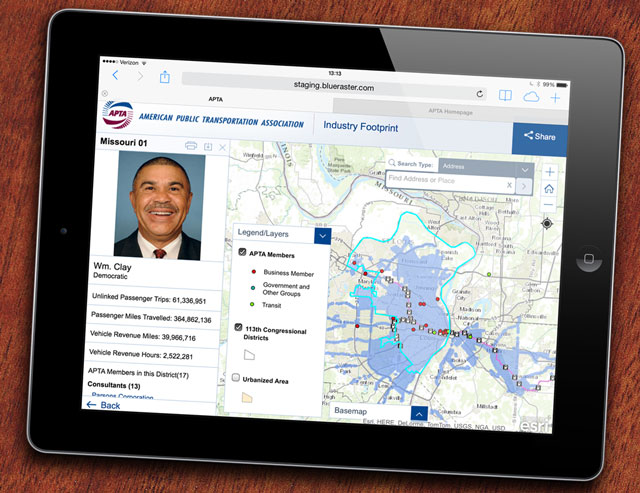
APTA promotes public transportation and advocates for continued support and funding from state and federal legislators.  This application displays APTA member locations around the nation, the breadth and depth of public transportation services offered, as well as key facts and statistics, all offered at the state and congressional district levels.  APTA also uses this tool to conduct “Washington Fly-Ins” with business members who meet with members of Congress and key congressional staff to explain why proposed cuts would threaten economic development, productivity and job growth across the country.

Manufacturers List by Congressional District

What’s new this year? We have added functionality and updated data feeds just in time for the 2017 APTA Expo and Annual Meeting which was held in Atlanta, Georgia from October 8 -11. The Expo attracted 12,000+ attendees exploring how innovation and technology accelerates every mode of public transportation. Updates to the application include:

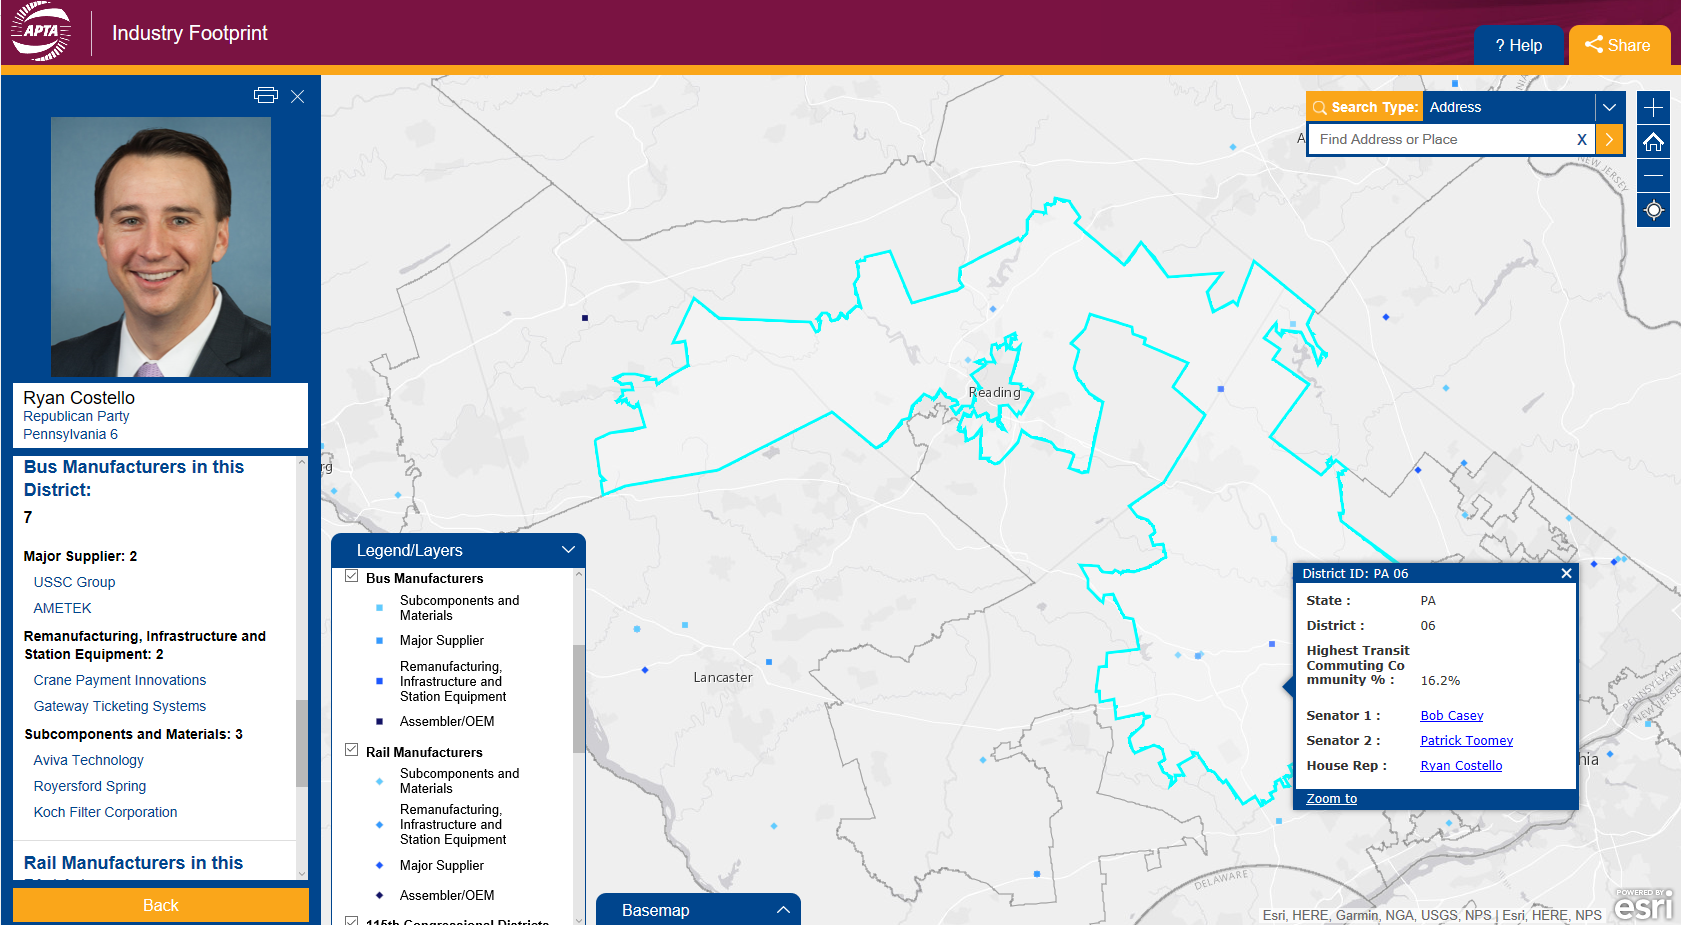
  • Rail and Bus Manufacturer lists are now available for each Congressional member and State Upper and Lower Chamber Legislators
  • Updated public rail lines, Amtrak lines, and bus transit buffers across the country using the TransitFeeds API  TransitFeeds Logo

We encourage you to go APTA’s Industry Footprint to check out the public transportation available in your area and see active APTA members and Bus and Rail Manufacturers within your congressional and state districts.

New Release: APTA Industry Footprint

Following the successful launch of American Public Transportation Association’s (APTA) Industry Footprint, Blue Raster has delivered Version 2. The web application provides users with a comprehensive understanding of the role of public transportation in their communities and throughout the United States. Given that public transportation provides essential mobility to people throughout the country, reduces congestion in crowded cities, and improves air quality, APTA hopes to encourage people to opt for it more often and fight for continued support and funding from state and federal legislators.

The latest version of Industry Footprint includes helpful new features:

  • Addition of bus and rail manufacturers to the map
  • Addition of state legislative upper and lower chambers to the map
  • Updated user interface

Now everyone can view APTA’s Transportation Industry Footprint to get key facts and statistics about where public transportation is available and how it’s being used in their state legislative and congressional district boundaries.

Blue Raster built upon the first version of the tool by integrating the Sunlight Foundation’s Open States API for up-to-date details on state legislators and state legislative districts. The transit information is obtained from TransitFeeds, which offers an extensive archive of standardized transit lines and schedules.

APTA Story Map Amplifies Advocacy Message

APTA Story Map - Stand Up 4 Transportation

The American Public Transportation Association (APTA) asked Blue Raster to create a story map to spread their message. According to APTA, public transit saw its highest ridership in 58 years at 10.8 billion trips, but the current federal funding bill is set to expire on May 31, 2015.

Although a long-term transportation bill is supported by the transportation industry in near unanimity, APTA wanted a way to connect their message with constituents and to broadcast it out to a wide audience.

The Stand Up 4 Transportation story map features first-person narratives describing how public transit is impacting people in all parts of the country and sectors of the economy. The story map strategically launched in coordination with national Stand Up For Transportation Day on April 9th, a keystone event for showing national bill support.

Story from Minneapolis, MN

The map provides users with quick data visualization and offers information important at the community level including:

  • Transportation funding
  • Manufacturing Jobs
  • Rail and bus services

The ability to share the map on social media enabled APTA to amplify their message. Launching the application helped propel #SU4T on Twitter, Facebook, and other social media. By using maps, APTA was able to show the scale and impact of public transit, in a new way that text could not.

#SU4T

View the Stand Up 4 Transportation story map and see for yourself how your story can get in front of Congress and decision makers.

APTA Maps American Public Transportation with ArcGIS

Blue Raster has always been a big fan of public transportation. Our office is strategically located across the street from the CourtHouse Metro stop. When the American Public Transportation Association (APTA) asked us to build a national map of public transportation for their members, we were excited to participate in their mission of ensuring public transportation accessibility to communities across the country.

APTA Maps

APTA set out to create an interactive map to provide their members with an advocacy and outreach tool to educate public and elected officials about the vital role of public transportation. With ArcGIS Online Accelerate solutions, Blue Raster built an interactive Industry Footprint map that leverages APTA’s ArcGIS Online subscription as their mapping and analysis tool. The map includes:

  • APTA members
  • public rail lines and stops
  • bus stops buffered to 0.25 mi
  • 2010 Census urbanized areas
  • 113th Congressional districts

By using the map, users can view transit information localized to their community, as well as to the regional and national level.

Several of the layers include custom information useful to APTA Members. This puts quick facts into the hands of APTA members, for example, the number of passenger miles traveled within a legislator’s district. Blue Raster integrated Sunlight Foundation’s Congress API v3 for complete and accurate congressional details.

APTA Maps work on tablets

Blue Raster queries a secure APTA member web service and geocodes addresses using Esri’s ArcGIS Online World Geocoder. The tool leverages the ArcGIS Online Portal API and server-side python tools to seamlessly integrate member geographic data.

The transit information is built from the General Transit Feed Specification (GTFS) data exchange. This specification defines a common format for public transportation schedules and associated geographic information. The GTFS data exchange is a site of “feeds” for public transit agencies to publish their data, and for developers to write applications that consume the data in an interoperable way. The result is a national layer of public transit in the Industry Footprint map.  Learn more about GTFS by visiting the Yay Transit! website that breaks down a GTFS feed for the ArcGIS user.

Contact us today to learn how your organization can benefit from our ArcGIS Online Accelerate solutions.