World Resources Institute

Supporting Sustainable Palm Oil in Indonesia

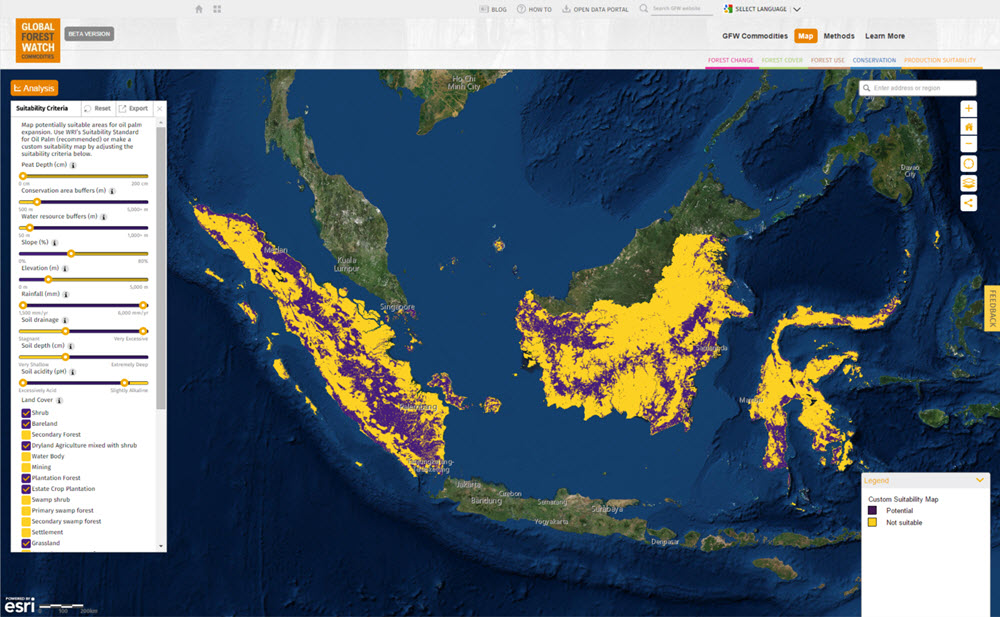
The World Resources Institute (WRI) is launching two powerful online mapping applications that offer unprecedented capabilities to support industry and government efforts to achieve more sustainable palm oil production in Indonesia.  The Suitability Mapper helps users find potential sites for sustainable palm oil production, using a customizable map. It empowers companies and government planners to use a standard, easily replicable method to find potential sites for sustainable palm oil production and plan field assessments for further investigation.  The Forest Cover Analyzer allows users to view change in forest cover over time in areas of their choice, using up-to-date satellite data.  It provides a unique set of monitoring tools to help buyers, investors, and governments strengthen incentives for avoiding deforestation when developing new plantations.

“Palm oil holds tremendous opportunities for people and business in Indonesia—and should be produced in a way that avoids destruction of vibrant lands and forests,” said Andrew Steer, President of WRI. “These dynamic new online tools will enable companies to better identify the best places for palm oil production and assess deforestation and other factors that are critical for long-term sustainability of this industry.”

Suitability Map in GFW Commodities


New Tools Help Forest Legality Alliance Reduce Illegal Logging

The Forest Legality Alliance, a joint effort of the World Resources Institute and the Environmental Investigation Agency, partnered with Blue Raster and others around the world to release two new web tools to help in their efforts to reduce illegal logging by supporting the supply of legal forest products.

The recent focus on illegal logging has made people wary of buying forest products from countries that are perceived to be high risk.  By providing useful advice and information about the due care process and supply chain facts, The Forest Legality Alliance hopes to  reduce the effort of exercising due care with its new Risk Tool. Using the Risk Tool, users can search for information about the forest products trade and relevant legality information by country or by species.  The goal of the site is to make it easier, cheaper, and less painful to examine forest product supply chains and improve transparency in the marketplace.

The Declaration Tool is designed to help importers understand the rationale for the Lacey Act Declaration (PPQ Form 505), which is required by the U.S Department of Agriculture for importers of wood products. The tool helps to reduce confusion over the data entry process by providing a wizard interface that steps through the PPQ505 Form, FAQs, and reference materials. The Declaration Tool also helps importers understand the importance of this form and its role in preventing the trade of illegal wildlife and plants.

Forest Legality Alliance Risk Tool

Forest Legality Declaration Tool

Preserving Rainforests with Project POTICO

To preserve endangered rainforests in Indonesia, the World Resources Institute (WRI) has launched Project POTICO (Palm Oil, Timber, Carbon Offsets), a revolutionary approach to ecosystem management.  Working with spatial analysis tools developed by Blue Raster, Project POTICO aims to divert planned oil palm plantations away from virgin tropical forests to already degraded lands, a swap that will prevent deforestation, reduce greenhouse gas emissions, and encourage sustainable agricultural development.

Using the Suitability Mapper, Project POTICO is mapping degraded lands in West Kalimantan, Indonesia, to identify areas with high potential for sustainable oil palm expansion.  This interactive web application produces a customized map of potentially suitable locations based on user inputs and a methodology developed by the WRI and its local partner Sekala.  The custom maps can be used by government officials for land-use planning and zoning decisions and by oil palm companies to prioritize areas for project-specific field assessments. To create these custom maps, the application uses Esri ArcGIS Server Flex API and Pixel Bender for geoprocessing directly in the browser.

Blue Raster also developed the Forest Cover Analyzer, which supports Project POTICO’s efforts to monitor changes to the forest cover.  Using this application, government agencies and nongovernmental organizations can compare current and historic satellite imagery of Indonesian forests, and determine if oil palm companies are using degraded lands and meeting the standards of the Roundtable on Sustainable Palm Oil.  In addition to using Esri ArcGIS Server Flex API, the application uses the Flickr API, allowing users to explore over 190 field points and panoramic images collected to verify maps.

The beta versions of these two websites were presented at the Roundtable on Sustainable Palm Oil conference in Malaysia November 2011 and feedback collected from this event will be used to inform revisions to the public website to be launched in 2012.  For more information on the project please contact beth.gingold@wri.org.

Aqueduct Atlas Helps Project Water Risks

As the world’s rapidly growing population places increasing stress on global water resources, companies and investors are paying closer attention to water use and water risk management.  To help  understand and manage  exposure to geographic water risks, the World Resources Institute (WRI) and its partners are working with Blue Raster to launch the Aqueduct Water Risk Atlas.  Coca-Cola donated maps and data developed to help in understanding and managing exposure to water risks in facilities globally.  Through Aqueduct this information has been made accessible to the public in an interactive, easy-to-use platform, providing a comprehensive and credible metric for measuring geographic water risks.  The Aqueduct Atlas can create high resolution maps of water risks tailored to your unique risk exposure profile.

This interactive application, built using ArcGIS Server, helps companies to quantify and map water risks on a local scale and project future water use and availability.  The current mapviewer includes the Yellow River basin in China.  In the future, the Water Risk Atlas will analyze risk for a wide range of sectors and river basins including the Murray-Darling, Orange-Senqu, and Colorado River basins.

Using the Water Risk Atlas, users can generate detailed, multi-variable maps by adjusting the weight and priority of various factors, including risks related to water scarcity, deteriorating quality, increasing prices, poor water governance, or increasing competition for water resources.  The Atlas can be used to model what-if scenarios, identify risks and opportunities , and share water risk information.  To learn more, visit the water risk mapping platform at http://www.wri.org/our-work/project/aqueduct.

Aqueduct - The Water Risk Atlas

WRI Tracks Nutrient Pollution in Coastal Waters

When the World Resources Institute (WRI) wanted to draw attention to nutrient pollution of coastal waters, they turned to Blue Raster to develop an interactive website and GIS application to depict and track this growing problem.  The central feature of the WRI’s Eutrophication and Hypoxia: Nutrient Pollution in Coastal Waters website is an interactive map, which combines geographic, environmental, and time-lapse data.

Within the past 50 years, eutrophication—the over-enrichment of water by nutrients such as nitrogen phosphorus—has emerged as one of the leading causes of water quality impairment.  Eutrophication can result in hypoxia (or oxygen depletion), which can destroy aquatic life and create dead zones in coastal regions. “Until now, a lack of information and monitoring has been a major impediment to understanding the extent and impacts of ‘dead zones’ and eutrophication in coastal ecosystems,” said Mindy Selman, senior water quality analyst at WRI.  “This website is an important step forward because it compiles the current information into a central location to raise awareness and offer solutions for controlling nutrient pollution.”

Blue Raster developed the user-friendly application using ArcGIS Server and Flex API to create a comprehensive look at historical and recent eutrophic and hypoxic events around the world.  The interactive map allows users to investigate 762 coastal areas around the globe that have been affected by eutrophication and hypoxia. The data, which was compiled by analysts at WRI and the Virginia Institute of Marine Science, includes 479 sites identified as experiencing hypoxia, 55 sites that once experienced hypoxia but are now improving, and 228 sites that experience other symptoms of eutrophication, including algal blooms, species loss, and impacts to coral reef assemblages.

Using Flickr, YouTube and Delicious, Blue Raster provided users with the ability to access and share other resources on eutrophication and hypoxia, including publications, photographs, and video.  The site also allows users to provide updates to the maps and databases based on their knowledge of local coastal water conditions. To learn more, please visit WRI’s website on nutrient pollution in coastal waters.


Page 8 of 9