Our Work

Blue Raster helps you tell your story through interactive
mapping technology. Make your message clear, exciting,
and user-friendly for both mobile and web platforms.

World Wildlife Fund

Trillion Trees: An Interactive Look at Forest Regeneration

Trillion Trees organizations

Trillion Trees is a joint venture between three of the world's largest conservation organizations - BirdLife International, Wildlife Conservation Society (WCS) and WWF - to end deforestation and restore tree cover. The organization aims to protect and restore forests to achieve one trillion trees by 2050, for the benefit of people, nature, and a stable climate. To do so, they:

      • Implement work on the ground to protect and restore forests,
      • Influence global policy and private sector practices, and
      • Inspire us all to value, protect and restore forests.

Key to these efforts is telling the story of where their work has made a difference and where the need is the greatest. Being able to do so in an interactive and compelling way can lead to more support both financially and politically.
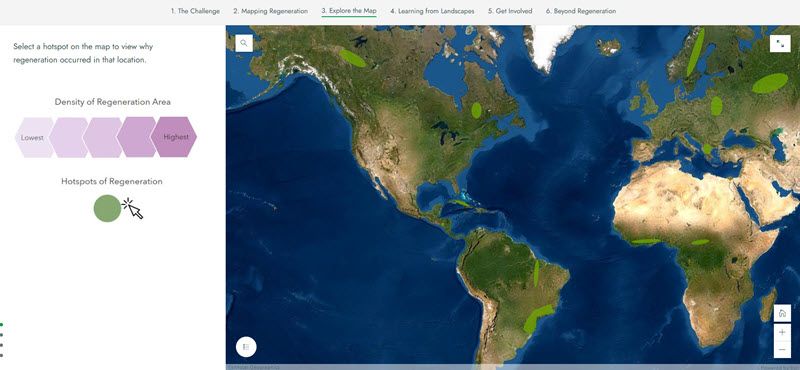
Trillion Trees StoryMap

Trillion Trees looked to Blue Raster to tell their story via an ArcGIS StoryMap. Using data sets from a variety of research, the Trillion Trees story map shows how nearly 59 million hectares of forests – an area larger than mainland France– has regrown since 2000. This research informs forest restoration plans worldwide, giving a picture of the areas where focusing restoration efforts could be most beneficial.

Trillion Trees StoryMap

With the StoryMap application, Trillion Trees was able to outline the story they needed to tell, select the data to use, develop content to provide context to the data, and create graphics. Much of this work is automated in the platform, allowing non-developers to build an incredibly interactive page that reads like an in-depth magazine article in a mainstream media source.

The Trillion Trees story map includes:

      • An overview of the challenge
      • A definition of regeneration
      • The impact of discovered regeneration
      • An interactive map showing viewers the areas of high regeneration along with descriptions of why/how that regeneration happened.
      • In depth analysis of two areas’ regeneration

The content provided shows the impact policy changes regarding forestation, environmental protection, and agricultural regulation can have on tree growth.

Tracking Grassland Loss in the Great Plains: WWF and Blue Raster Release Plowprint Web Application

Temperate grassland ecosystems, like the Great Plains of North America, are home to a wide variety of plants and animals and provide key ecosystem services, such as soil stabilization, carbon sequestration and water filtration. These lands are under increasing threat of loss due to the expansion of agriculture for food and fuel production and urban development. In the Great Plains, only half of all intact grassland remains, much of it on poor and marginal quality soils. Conversion of grassland to crops in areas of marginal soil is particularly hazardous to ecosystems due to the greater use of fertilizers required to make these lands productive and a higher risk of erosion.

To understand and address these issues faced in the Great Plains, Blue Raster is working with the World Wildlife Fund to bring the annual Plowprint Report online. Since 2016, the Plowprint Report analyzes grassland loss across the Great Plains. Published annually, the report provides a broad overview of trends within large study regions of particular conservation interest, such as the Missouri River Basin (MORB).

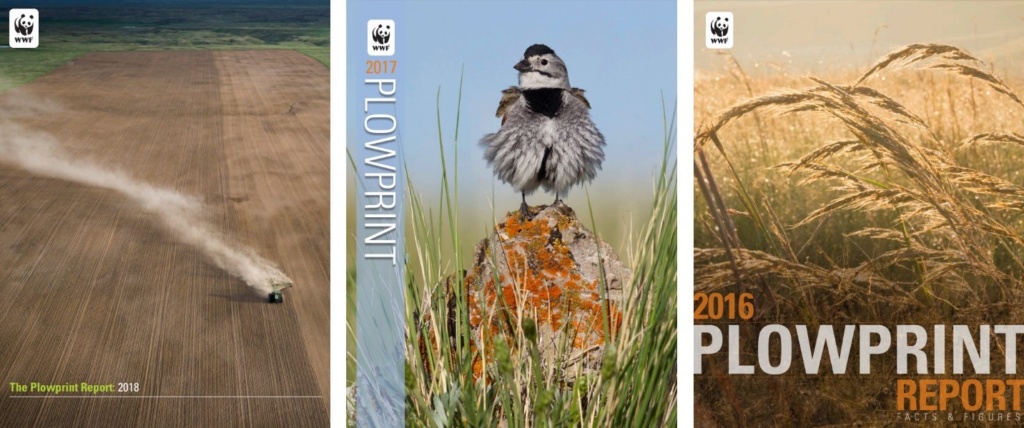
plowprint images
Since 2016, the Plowprint Report has published annual findings on grassland loss across the U.S. Great Plains.

“Being able to share the Plowprint Report as an interactive web map is an exciting opportunity to increase awareness about grassland loss across the Great Plains. The Great Plains covers such a large area that it is easy to become disconnected from the landscape beyond where one regularly interacts, and having maps like this with great visual displays at your finger tips allows us to easily see what is happening not just in your community, but across the county, state, region, and beyond.” – Patrick Lendrum, Science Lead at World Wildlife Fund

Plowprint Report Details

The report leverages the USDA’s Cropland Data Layer (CDL), the Canadian Annual Crop Inventory (ACI), the National Land Cover Database (NLCD), US Census TIGER 2019, and Canada Road Network 2018 data to identify areas of “Intact” (grassland) and “Plowprint” (grassland converted to cropland) land by composition and ownership.

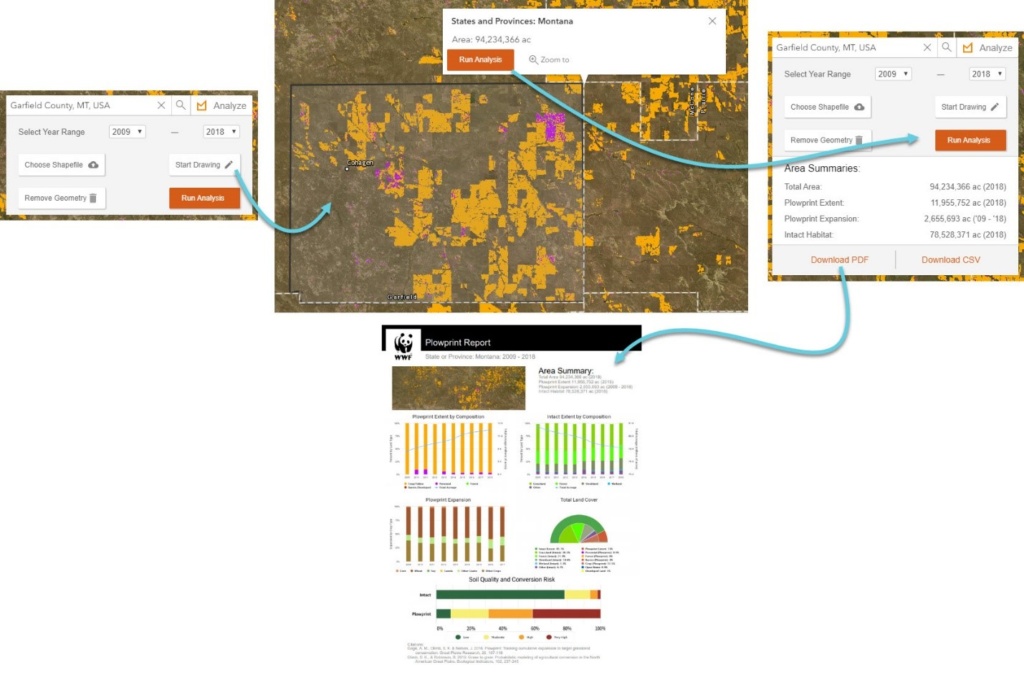
These areas are visualized in the new interactive Plowprint web map application. To quantify grassland loss, users can select state or county boundaries, draw, or upload their own areas-of-interest (AOI) for on-the-fly analysis. The tool generates a report with a collection of charts that help the user understand their AOI’s grassland characteristics and trends.

Plowprint image
By leveraging the ArcGIS Image Server, the Plowprint app allows the user to run an on-the-fly analysis of grassland loss for their chosen area of interest (AOI). Outputs can be downloaded as a PDF or CSV. Above, the PDF document provides compelling visuals for understanding trends in the data.

The tool leverages ArcGIS Image Server to quickly analyze the user’s AOI to deliver a report of trends in land use conversion and composition. Users can select data going back to 2009, providing a detailed view of historical patterns. Once the analysis is run for the selected area, users have the option to download the results as a PDF document and CSV file.

With its ability to quantify grassland loss on-the-fly and generate powerful visuals along the way, this application will provide policy makers, companies, and landowners valuable decision making information about habitat conversion within areas under their control. With Great Plains comes great responsibility to monitor these vital ecosystems – Plowprint enables this action.

Identifying and Understanding Changes to Protected Areas

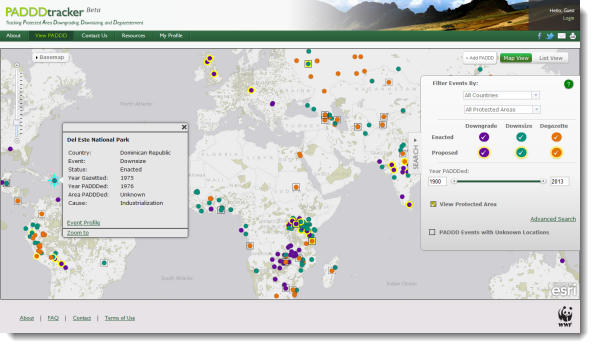
Conservation policy assumes that national parks and other protected areas are permanent fixtures on the landscape, but recent World Wildlife Fund (WWF) research demonstrates that these precious natural resources are at risk.  To understand and address the changes happening to existing protected areas, WWF worked with Blue Raster to develop PADDDtracker.org, an online portal that uses spatial mapping to track protected areas threatened by Protected Areas Downgrading, Downsizing and Degazettement, or PADDD.

PADDD is the legal process of making protected areas weaker (downgrading) or smaller (downsizing) or eliminating them entirely (degazettement).  While some of these changes offer the opportunity to restore lands to indigenous communities or allocate conservation resources more efficiently, others present challenges to the protection of nature.  PADDDtracker.org will help scientists collect and analyze PADDD data, and share these findings with conservation organizations, government agencies, and concerned citizens everywhere.

Blue Raster and partner, Orion Creative Group built the user-friendly system integrating Drupal 7 and ArcGIS for Server 10.1. PADDDtracker.org features interactive maps that allow users to browse current and historical PADDD data, as well as contribute new information on PADDD events in their regions.  The site contains data collected on hundreds of PADDD instances affecting many protected areas across Africa, Asia, Latin America and the Caribbean.  By compiling and disseminating PADDD data, PADDDtracker.org will build awareness of PADDD and its conservation implications, and ultimately foster greater transparency and accountability in natural resource decision making worldwide.

PADDtracker

WildFinder Advances Knowledge of Species Biodiversity

To promote understanding of global species biodiversity and conservation, World Wildlife Fund partnered with Blue Raster to launch an updated version of WildFinder.  This online mapping application provides conservationists, educators, students and concerned global citizens with enhanced ability to study the global distribution of more than 26,000 species.

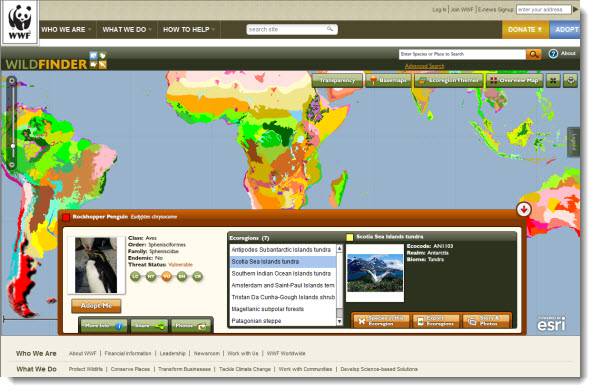
WildFinder gives users the ability to visualize and investigate the world’s most comprehensive dataset of the geographic distributions of birds, mammals, reptiles and amphibians. Scientists have used WildFinder to conduct research that otherwise would have required a time-consuming search of hundreds of references.  This interactive application provides the ability to search for wildlife by location, species name (common or scientific) and ecoregions.  Users can explore a variety of thematic ecoregion maps such as terrestrial biomes, species endemism and richness, as well as freshwater and terrestrial rarity, providing geographic context to user queries.

New features in this latest version of WildFinder include increased visualization and context for both species and ecoregions through photos from Flickr and Arkive, new thematic maps, details on ecoregions and updated threat status information for species. The application applies the technologies of ESRI ArcGIS Server, Oracle, and Adobe ColdFusion as well as the Flickr and ARKive APIs.

World Wildlife Fund – Coral Resilience Mapping Application

46logo.jpgBlue Raster has contributed an ArcGIS Server Flex API application for the World Wildlife Fund to support the Climate Change LEADS: Linking Environmental Analysis to Decision Support project.   The tool allows users to explore water quality patterns throughout the Florida Keys National Marine Sanctuary. These results are based on quantitative landscape ecology and GIS techniques using existing and emerging data to perform an analysis of the spatial and temporal relationships between environmental factors and coral bleaching response to suggest patterns of resilience within the Florida Keys National Marine Sanctuary.  This is very specific to the Keys, but the scientific concepts if applied world-wide would provide one of the few “global” (near-shore environments) data sets and analytical capabilities.
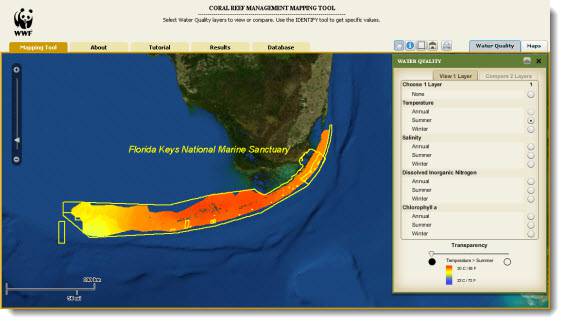

Coral Resilience


Page 1 of 2