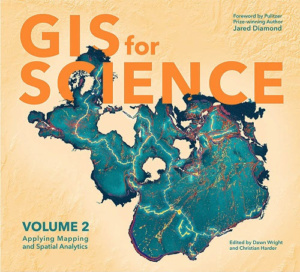
Deforestation impacts the environment in many ways. Habitat loss, desertification, increased greenhouse gas emissions, and climate change are just some of the negative effects. In an effort to understand trends in deforestion, Blue Raster collaborated with the World Resources Institute and Esri to publish a study about using spatial statistics to identify Emerging Hot Spots of forest loss. We are excited to announce that this work is part of a new publication.

Featured in the new Esri Press book, GIS for Science, “Tracking Global Forest Loss” explores the study and the use of advanced geospatial tools to analyze and monitor forest loss throughout Brazil, Colombia, the Democratic Republic of the Congo, and Indonesia.
GIS for Science: Applying Mapping and Spatial Analytics, Volume 2 will officially be released in October 2020, but the pre-release volume is available digitally at this year’s Esri User Conference.
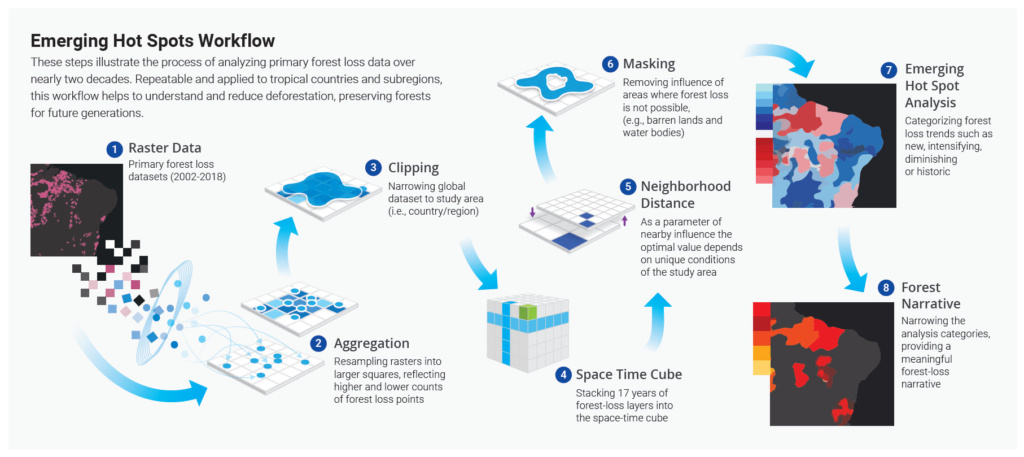
Using Esri’s Emerging Hot Spot Analysis, Blue Raster helped develop a workflow for mapping changes of deforestation through time and visualizing the impact of environmental policy across the world. The Emerging Hot Spot Analysis tool detects trends in data by analyzing new, intensifying, diminishing, and sporadic hot and cold spots. When analyzing for deforestation trends, Blue Raster worked to identify continual trends for hot spots of tree cover loss and cold spots of diminishing loss.

As the threat to our environment grows, scientists are working with cutting-edge GIS technology to help decision makers, technical experts and the broader public better understand trends in deforestation and improve future forest monitoring. With the ability to quantify deforestation loss over time, governments and other interest groups can create more effective policy over time.
Related Posts
- Global Forest Watch Fires: New Fire Monitoring Capabilities
- GFW Pro: Managing Deforestation Risk in Commodity Supply Chains
- Promoting Sustainable Forestry Practices with High Resolution Imagery
- Jane’s Green Hope: Blue Raster supports 87 Years of Jane Goodall’s Impact
- Saving Wilderness Areas with the Wildlife Conservation Society (WCS)
