As communities around the United States seek to mitigate the impact of climate change by reducing their greenhouse gas (GHG) emissions, the importance of land use to the GHG balance has become more apparent. About one third of human caused GHG emissions each year are sequestered in forests and trees but most communities do not include forests and trees in their inventories. To help fill this gap, the World Resources Institute (WRI) and Local Governments for Sustainability (ICLEI) developed the Land Emissions and Removals Navigator (LEARN) tool.

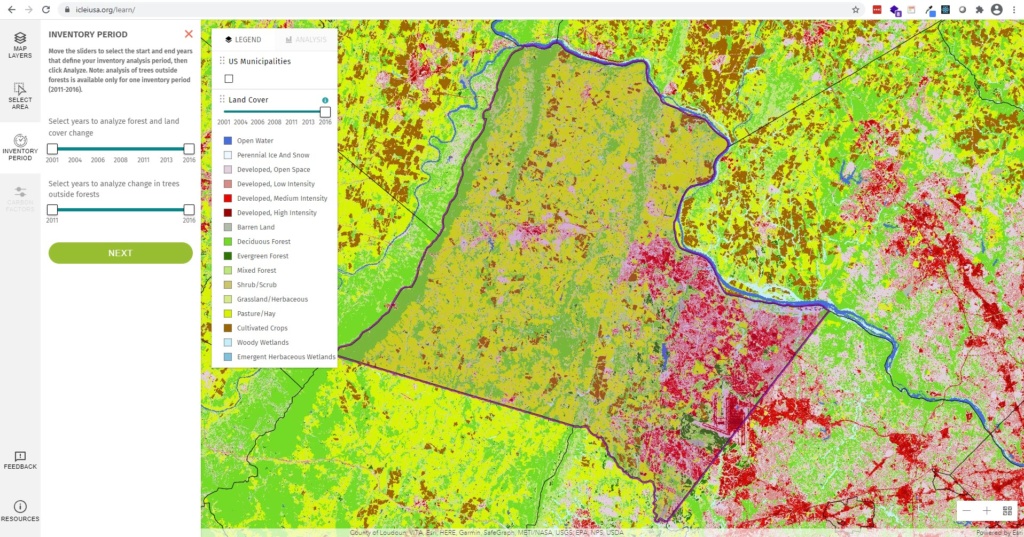
The LEARN tool provides an intuitive step-by-step workflow for communities to assess their net GHG balance based on land-use and land-cover changes. Once users have selected or uploaded their municipal boundaries and inventory period, the tool calculates land cover change using National Land Cover Database (NLCD) data. Users can then explore a change image to quickly see where areas are being converted to and from forests.
As the characteristics of the forests within the municipality impacts the amount of carbon emitted or removed, the change image is then compared to a carbon stock map developed from US Forest Service data based on the age and type of forest. NLCD tree canopy data is also used to identify addition or removal of trees-outside of forests to ensure a comprehensive assessment. Forest disturbance data for insects, fires, and other disturbances are also incorporated into the GHG balance. Finally, users can input the value of GHG removals from Harvested Wood Products (HWP) within the inventory period as HWP continue to sequester carbon.

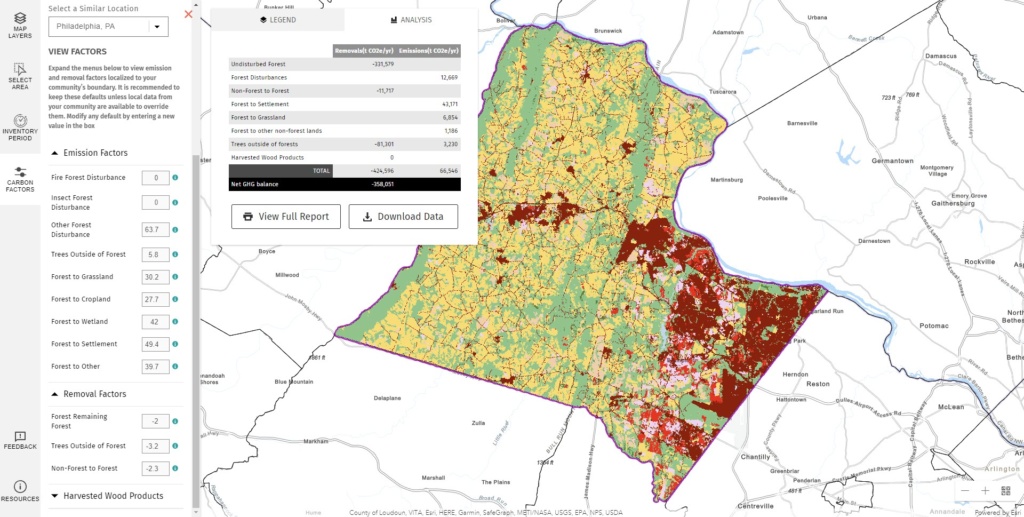
Once the user has gone through the four simple steps to complete the audit, they are presented with an easy-to-understand table showing their community’s Net GHG Balance and the source of the emissions and removals. A PDF report and CSV data are also available to provide detailed analysis of the land-use and land-cover change with charts and graphs as well as the carbon factors for emissions and removals used.
The LEARN Tool was developed using the Esri JavaScript API and ArcGIS Image Server to provide the analysis.
- Posted in
- Greenhouse Gas
- ArcGIS Image Extension for Server
- Climate
- Environment
- Forest
- JavaScript API
- Land Use
- Nonprofit/NGO
- Sustainable Development Goals
Related Posts
- New Features in the LEARN Tool Expand Functionality for Assessing GHG Emissions from Land Use
- Global Forest Watch Fires: New Fire Monitoring Capabilities
- Protecting Indigenous & Community Lands With LandMark
- National Fish and Wildlife Foundation Carbon Benefits Calculator
- Improving Deforestation Risk Management in Commodity Supply Chain
