Using GIS to map inequality is a powerful tool for understanding how inequity and place are inherently connected. Recently, the Maret School and Blue Raster partnered to give students the skills and resources necessary to map historical inequality in DC to deliver valuable resources for the DC community and beyond.
Blue Raster developed and delivered basic and intermediate GIS instruction for Maret’s Mapping Inequality in DC class.
Using Blue Raster’s instructions through ArcMap and ArcGIS Online, students learned to:
- Create, style and update maps.
- Add Census demographic layers and features to maps.
- Visually analyze historical patterns in data.
- Create compelling static maps, as well as interactive Story Maps to illustrate and explore inequality.
Students explored issues such as redlining, health systems, access to public transportation, and other issues relating to inequality.
Students worked in teams to create research questions and then blend demographic data with a digital mapping
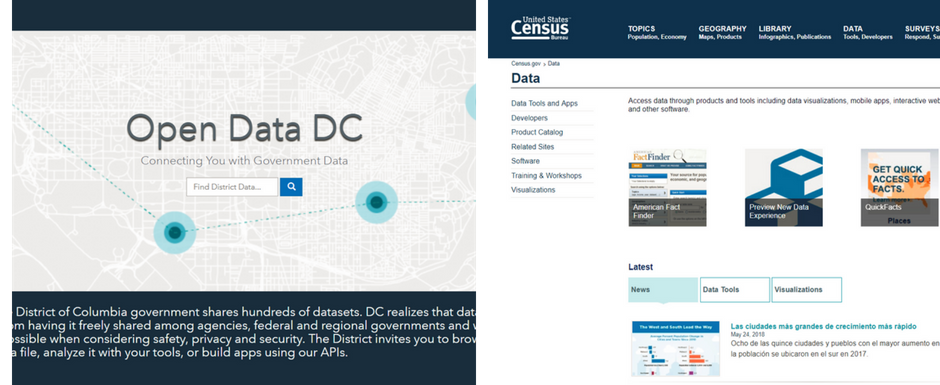
program to draw conclusions about patterns of inequity in DC. Students learned to take advantage of available resources, including open data and census portals, in order to produce insightful analysis.
Blue Raster understands that equity and place are inherently connected. We believe that every aspect of a class – researching, learning, analyzing, and communicating – benefits from ArcGIS and spatial thinking.