Introducing the National Audubon Society’s Migratory Bird Project: Bird Migration Explorer
Since 1905, the National Audubon Society has worked to protect birds and the places they depend on for survival through science, advocacy, education, and on-the-ground conservation. With over 500 chapters across the United States, the National Audubon Society is known by many for its impeccable and expansive conservation work.
With the launch of its Bird Migration Explorer platform in September 2022, Audubon and its partners hope to teach users—including birders, conservationists, researchers, and even the general public—about the joys, complexities, and unique connections of migration. Through a partnership with Blue Raster, the platform tells the stories of migratory birds across the hemisphere, features mapping of over 450 species’ travels, and visualizes the conservation needs of high priority areas. Our team was able to help make this application a reality by configuring, publishing, and visualizing data from over 400 research studies.

Exploring the Bird Migration Explorer’s Maps
Working with Postlight for all processing and publishing of datasets, and using Esri’s GIS software, Blue Raster was able to utilize ArcGIS Online to work with all of the given data and design the intricate and interactive maps within the digital Bird Migration Explorer experience.
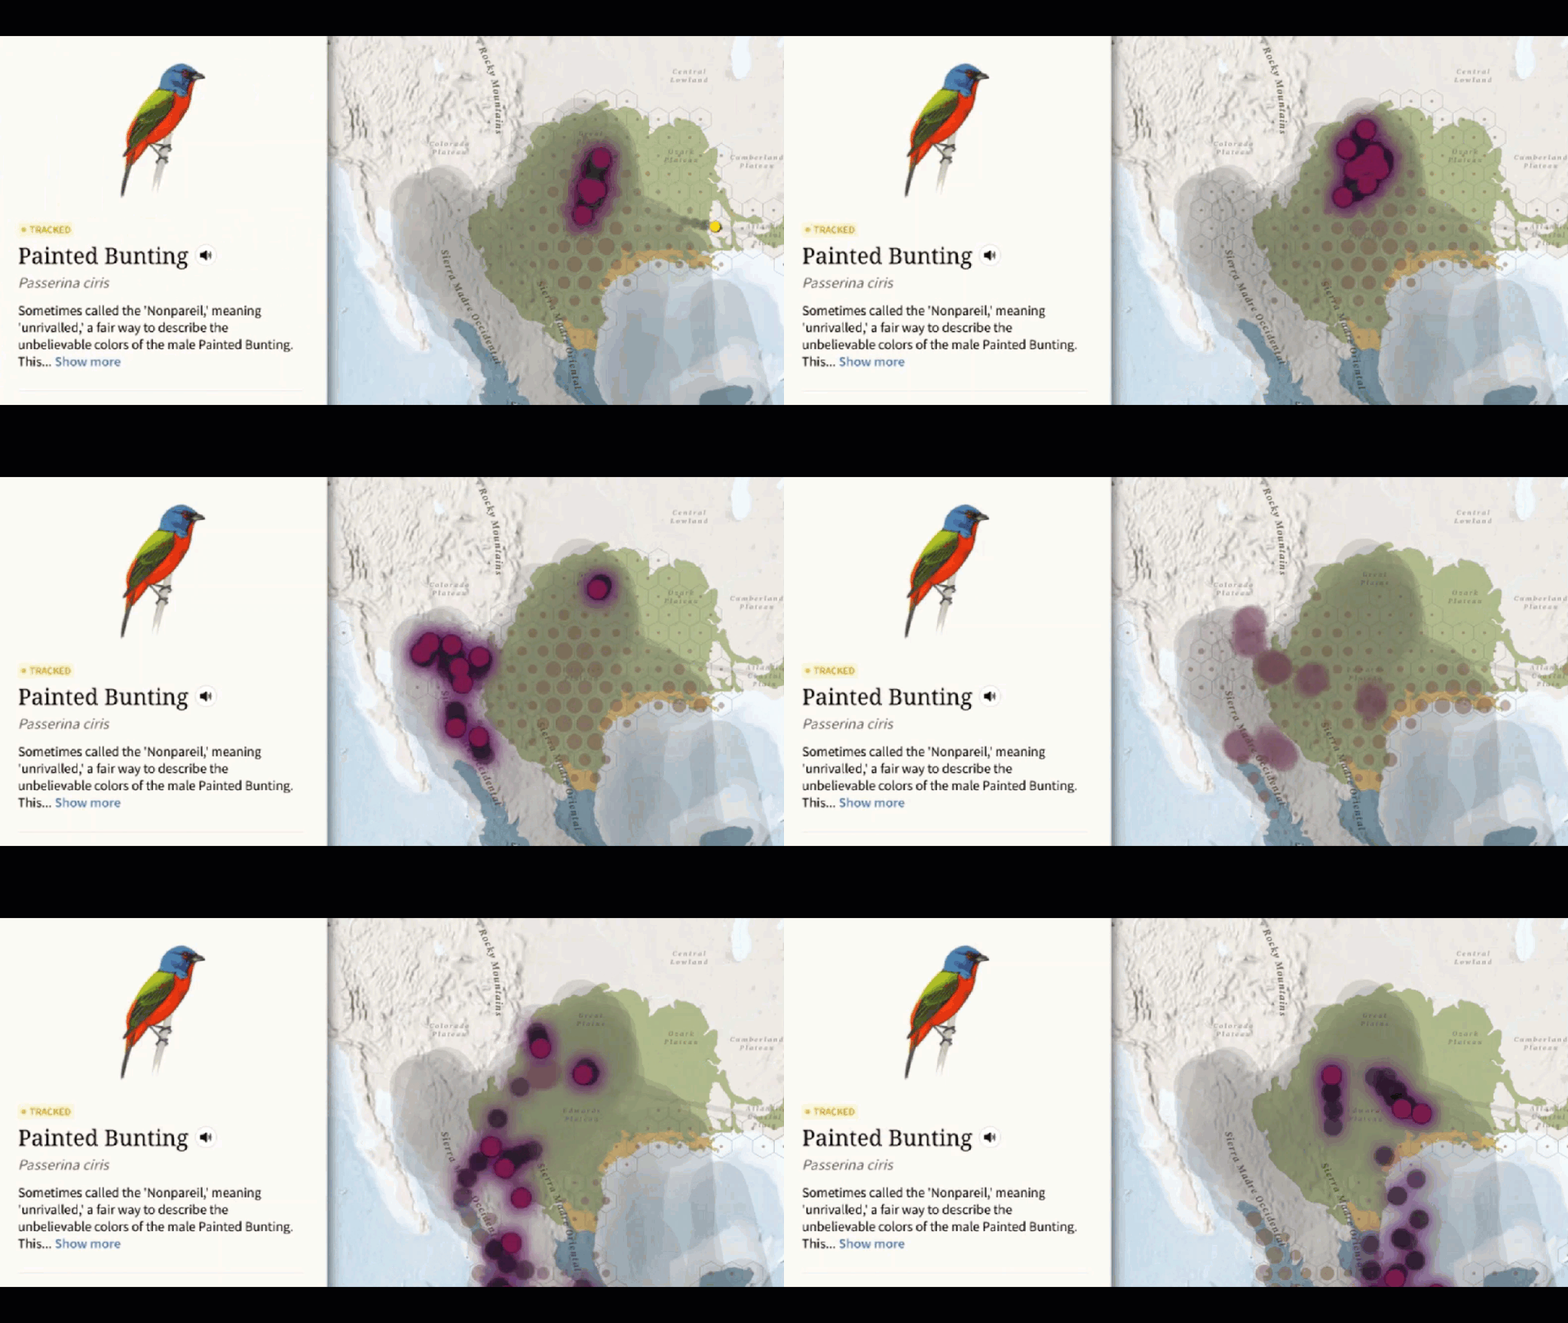
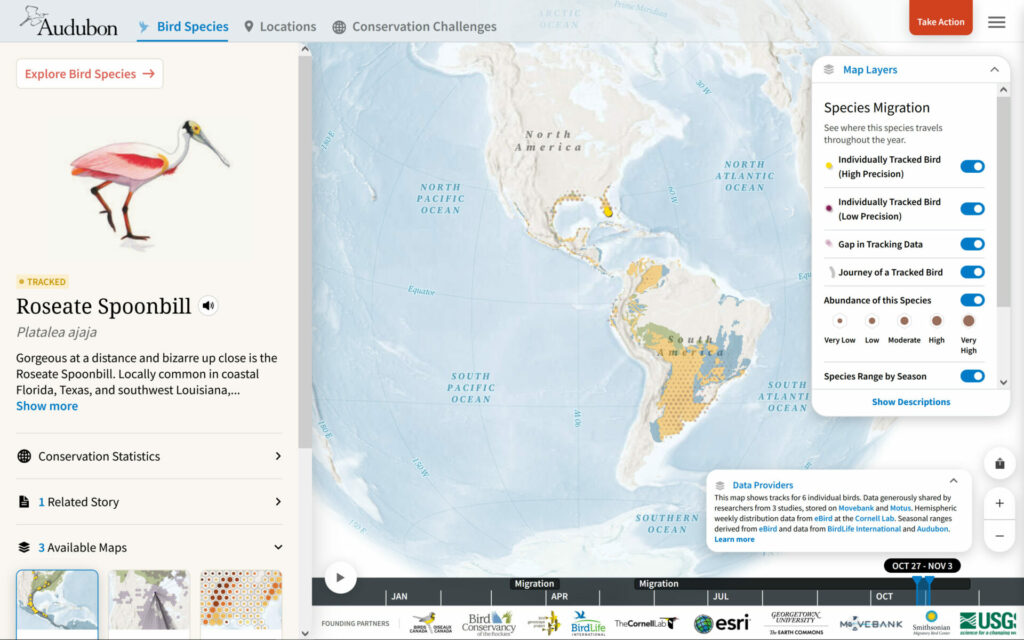
When the Explorer first opens, it prompts users to select a bird species. This opens the Species Migration Map, which displays the movement and migration of the selected bird throughout the hemisphere each year using real tracking data. With the precision of the tracking data being an important element to each bird’s journey, our team had to find a way to depict the accuracy of the technology used—such as GPS tagging or banding—to follow each species. Using purple dots for low precision and yellow dots for high precison, we were able to successfully illustrate the differences in tracking methods.
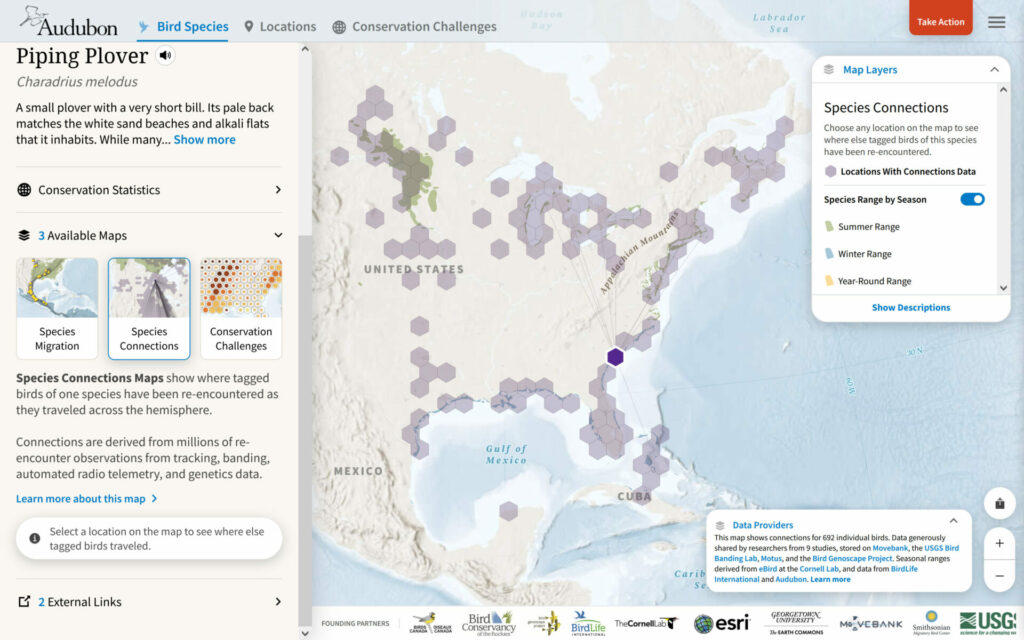
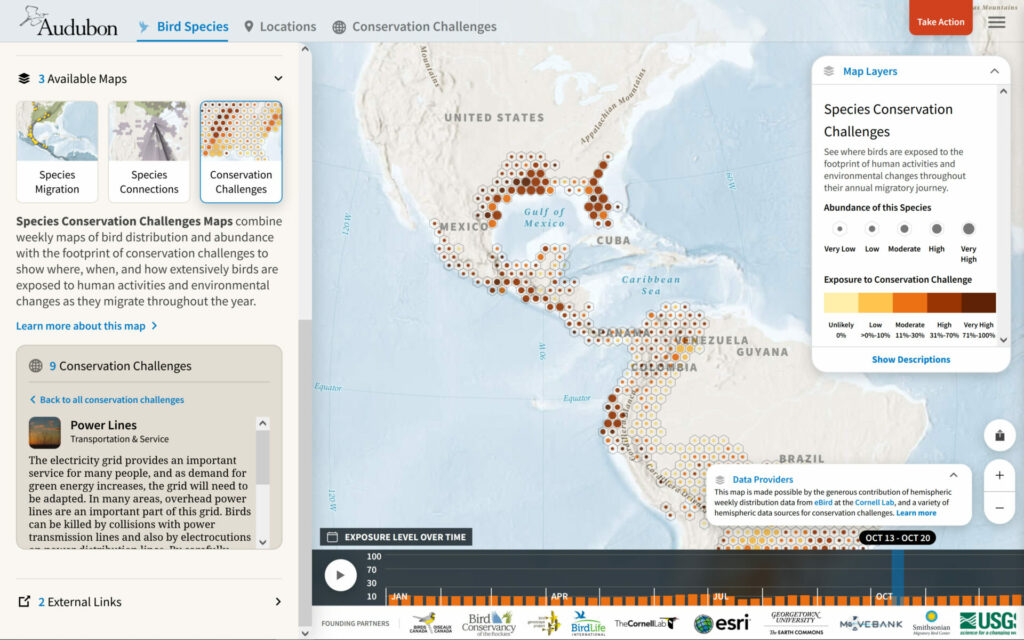
The Species Connections Map shows where tagged birds have been re-encountered as they travel across the hemisphere using tracking, banding, automated radio telemetry, and genetics data. The Conservation Challenges Map combines migration data with conservation challenges data to show where, when, and how birds are exposed to issues such as climate change, urbanization, pollution, and more throughout the year. We used time enabled data layers for the threat locations and the weekly location of the birds to showcase the most threating areas to each species during migration. This feature helps users understand their impact on the lives of these birds and how they can improve their journeys.


How We Helped Audubon’s App Take Flight
Blue Raster configured this data in a PostgreSQL enterprise geodatabase, calculated connections using spatial joins, and set up automation processes using Python to publish and manage updates to these datasets. This system was used across all species migration, species connections, and conservation challenges datasets to generate the incredible mapping for the Bird Migration Explorer. We also created a scripting process for writing and formatting citations using the Zotero API which are applied to each dataset on ArcGIS Online.
Ready to experience the full annual migration for over 450 bird species? Check out Blue Raster’s work for the Bird Migration Explorer now!
Blue Raster Can Bring Your Story to Life
Contact us to learn more about this application or to see how interactive mapping technology could work for you.
Related Posts
- Promoting Sustainable Forestry Practices with High Resolution Imagery
- Blue Raster Pioneering Imagery Management Technology and Delivery Workflows with ArcGIS
- Protecting Indigenous & Community Lands With LandMark
- Above the Waters: A Cinematic Journey Through the Delaware River Watershed
- Empowering Freshwater Communities and Indigenous People through Immersive StoryMaps
