Blue Raster helps you tell your story through interactive
mapping technology. Make your message clear, exciting,
and user-friendly for both mobile and web platforms.
Last year, Esri announced a new product in their platform– ArcGIS Hub. ArcGIS Hub supports collaboration between governments, businesses, citizens and their communities to accomplish data-driven Initiatives.
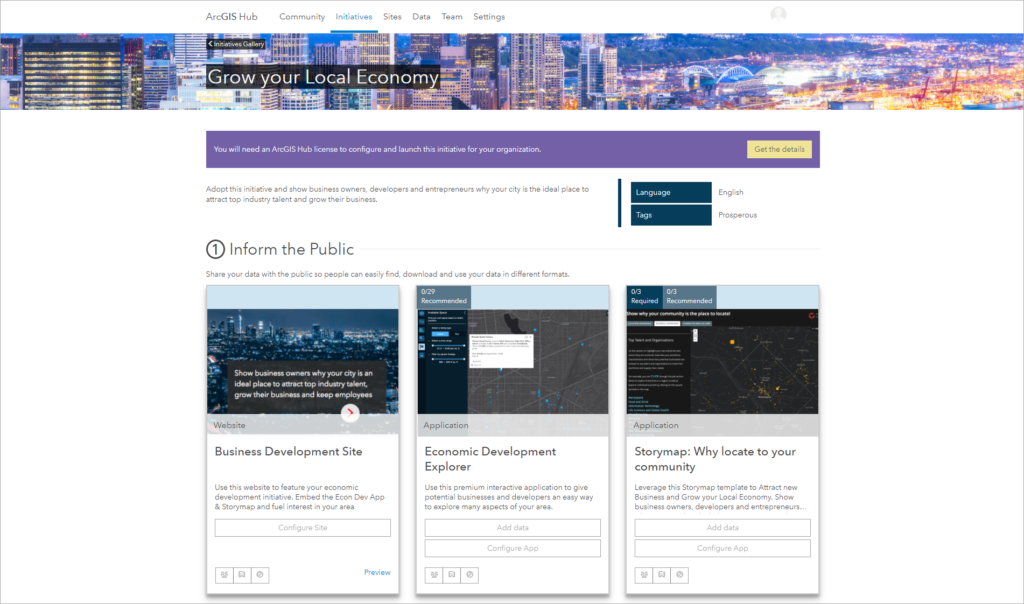
Recently, Blue Raster assisted Esri in the creation of the Grow Your Local Economy Initiative. This Initiative provides a suite of tools and applications you can use to show business owners, developers, and entrepreneurs why your city is the ideal place to attract top industry talent and grow their business. You can then show and monitor the progress your community is making towards growing your local economy.
The Grow Your Local Economy Initiative consists of four main tools:
Business Development Website – Features the economic development initiative. Users can embed the Economic Development Explorer & Storymap to fuel interest in their area
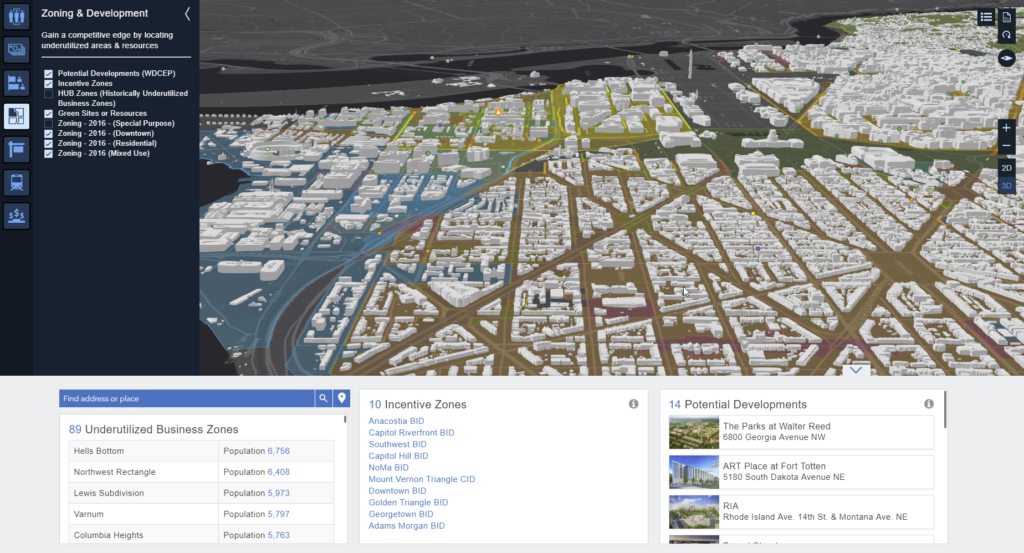
Economic Development Explorer – This premium interactive application gives potential businesses and developers an easy way to explore aspects of the area.
Why Locate to Your Community Story Map – This configurable story map template highlights why your city is the ideal place to attract top talent.
Survey capabilities – Gain input from current or potential business owners, developers, and entrepreneurs.
Companies in India are contending with a growing resource crisis: water shortage. With 54% of the country’s total area facing high to extremely high water stress, India is positioned to become one of the most water-stressed countries in the world.
A combination of water-intensive agriculture, increasing industrialization, and business-as-usual approaches to water management has put the water supply in danger. In a report published by the Water Resources Group, the national supply is predicted to fall 50% below demand by 2030. But companies, government agencies, and other water users have a new tool poised to make a meaningful difference, the India Water Tool 2.0 (IWT 2.0).
Today marked the launch of version 2 of this comprehensive, publicly available online tool. IWT 2.0 was created in partnership by the World Business Council for Sustainable Development (WBCSD), companies, research organizations, and industry associations.
“We are proud to have led the development of the India Water Tool. Water is a shared resource with finite volumes, resulting in collective risk. Collaboration is key to developing scalable and impactful solutions and driving their locally-relevant implementation.”
-Joppe Cramwinckel, Director, Water, WBCSD
The tool is the most comprehensive freely available resource to help companies, government agencies, and other stakeholders identify their water risks and prioritize water-management sites.
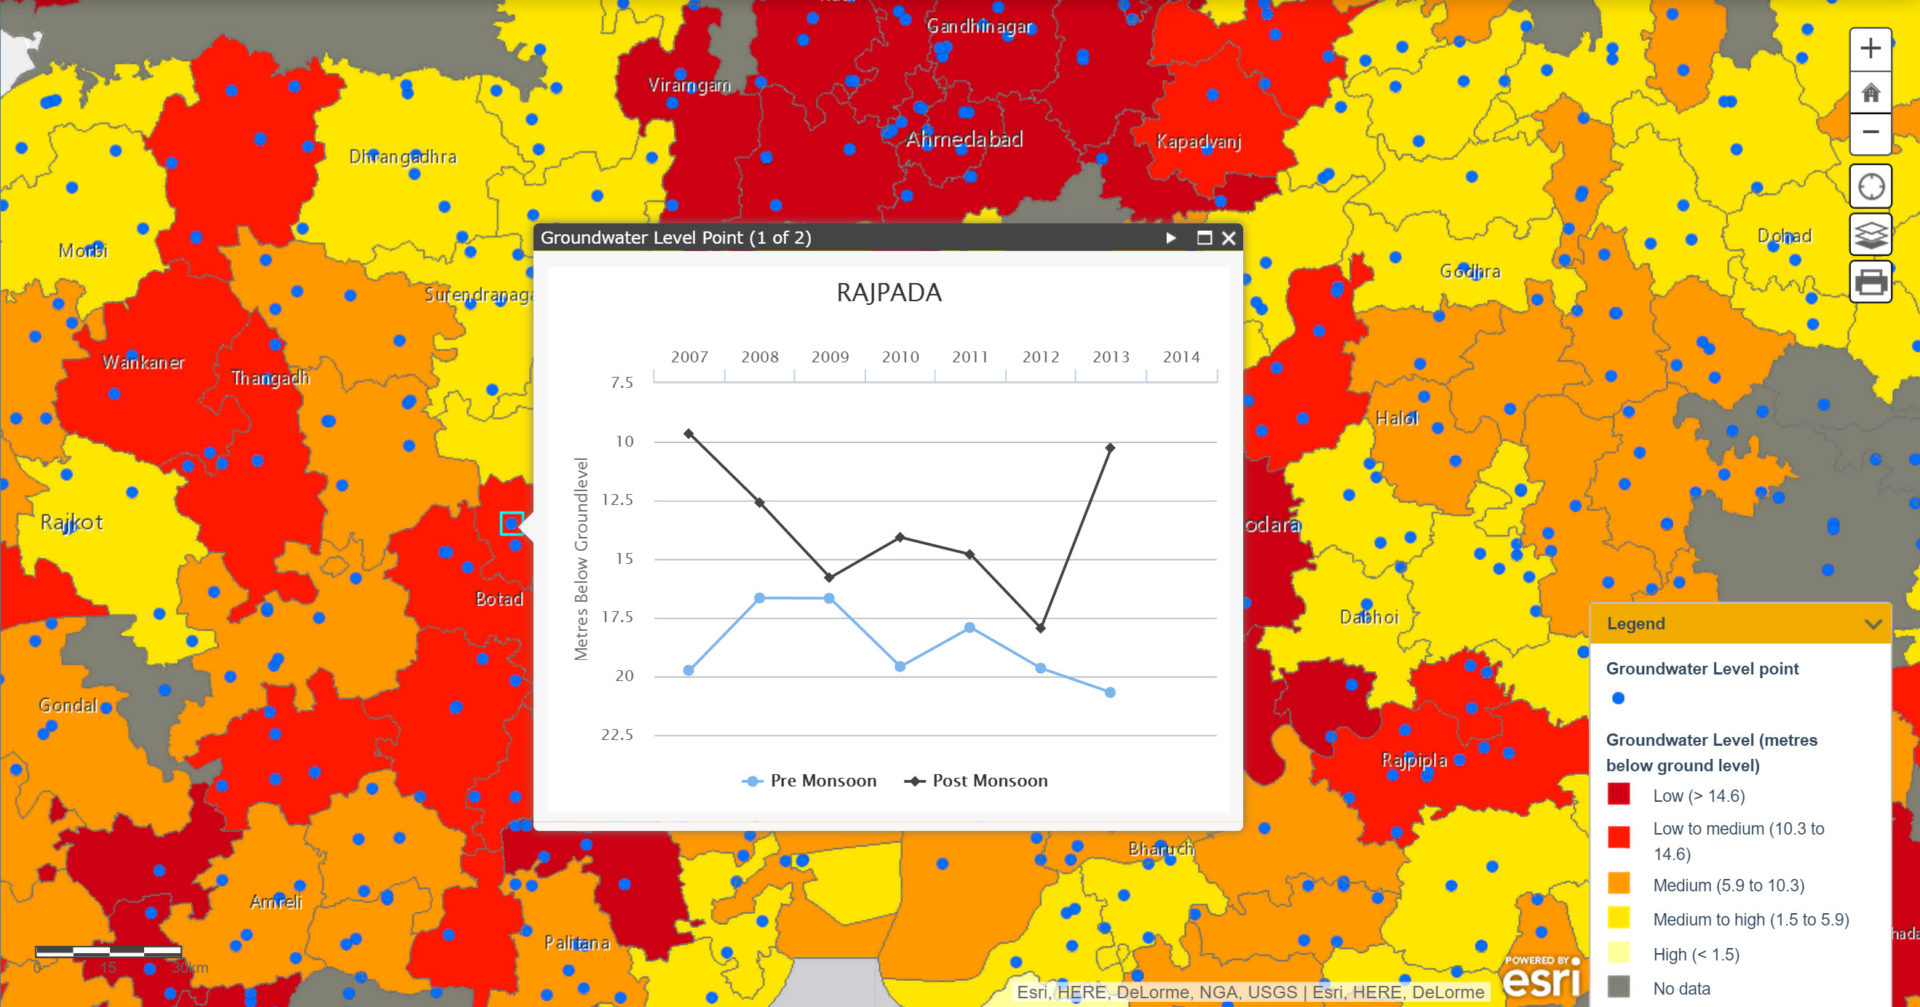
The web platform incorporates a series of interactive maps including groundwater level, rainfall, surface water availability, projected water stress, and water quality. Users can upload or enter GPS-based locations and receive custom reports featuring charts and graphs quantifying water-risk metrics. Built using the ArcGIS Desktop, ArcGIS for Server, and ArcGIS JavaScript API, the tool allows companies to answer questions including:
How many of my sites are in high stress regions?
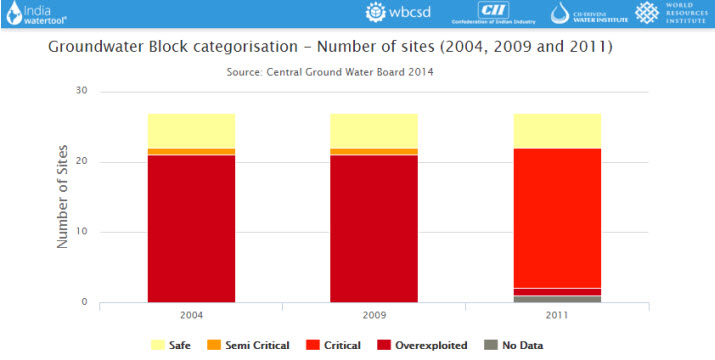
How many of my sites are in over-exploited or critical areas?
What is the net groundwater availability and projected demand for groundwater for my sites?
Are any sites in areas where the concentration of pollutants are above permissible limits?
The tool also addresses the shared risks between agriculture, industry, and domestic users. For example, of the 632 groundwater quality districts captured in the tool, only 59 meet Indian-government water quality safety standards. This equates to more than 100 million people living in areas of poor water quality. Among the 4,000 wells showing statistically significant trends, 54% have declined in the past seven years, and 16% have dropped over 1 meter per year. The map also shows a widespread pattern of high risk in Northwest India, a region where agriculture is a cornerstone of the economy. Producing 50% of the national government’s rice supply and 85% of its wheat, the area depends heavily on groundwater for these water intensive crops.
IWT 2.0 is the first step for understanding water-related challenges in India and planning for long-term water management. Check out and explore the India Water Tool 2.0 today.