Tag: demographic

Appalachia Community Data Portal

Blue raster is pleased to announce the release of the newest HealthLandsape tool – the Appalachia Community Data Portal.

Created for the Appalachian region, the tool enables users to explore demographic, education, income, and health disparities for more than 400 Appalachia counties. The tool marries datasets from the the U.S. Census Bureau, the Appalachian Regional Commission, the Robert Wood Johnson County Health Rankings, and the Centers for Medicare & Medicaid.

Economics

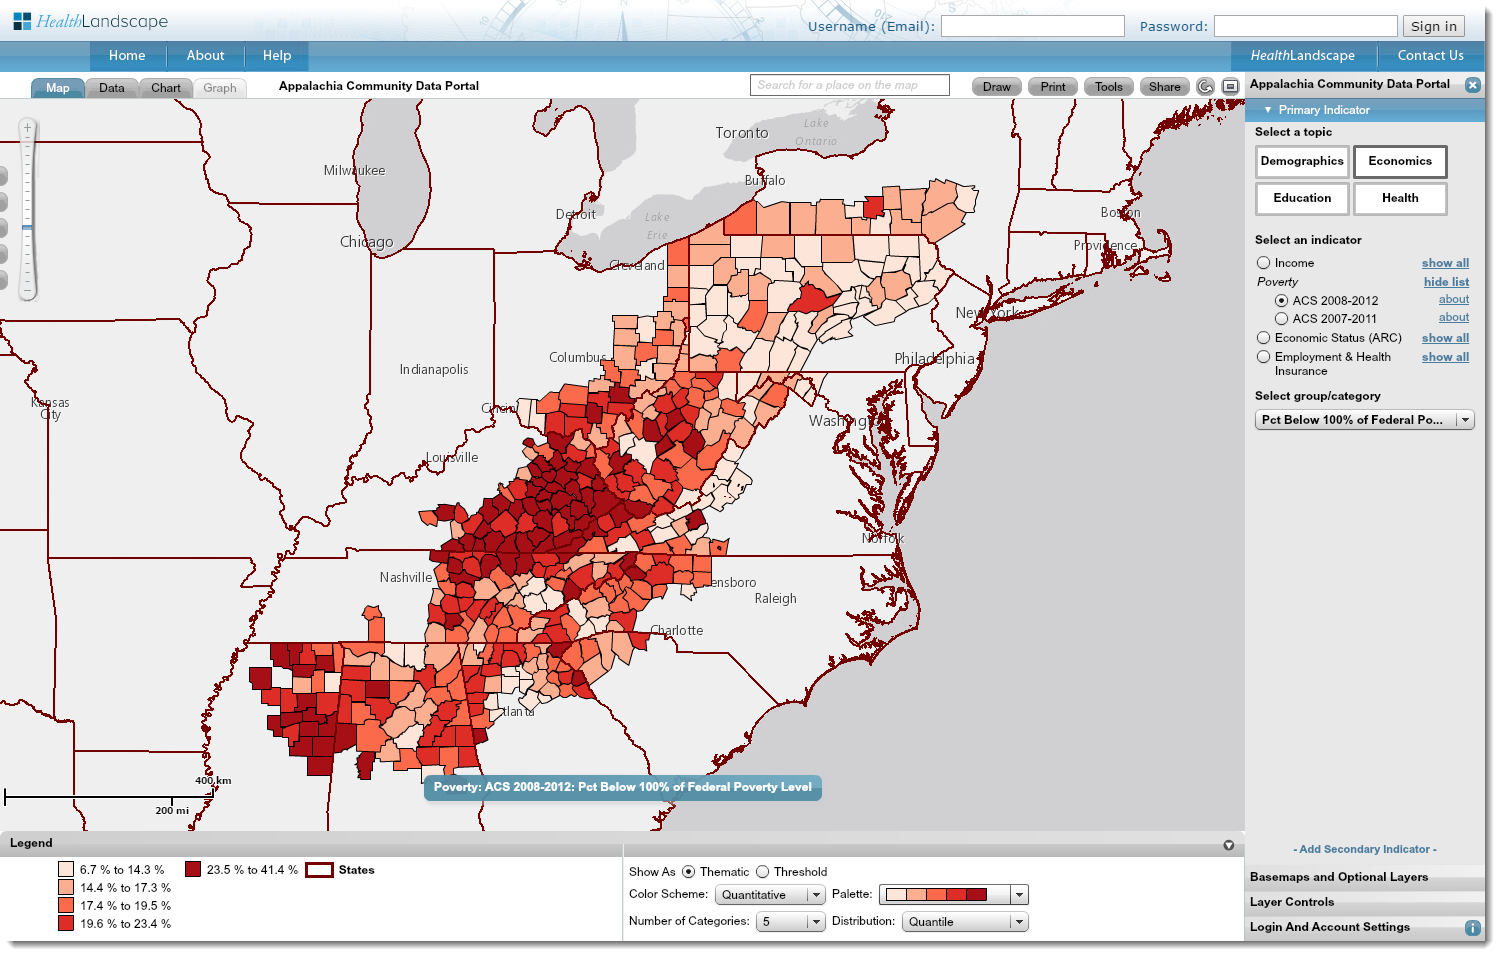
Using the Appalachia Data Portal tool, users can create side-by-side maps between indicators (for example, diabetes and poverty) to visualize potential relationships. Users can also overlay infrastructure data such as interstate networks or locations of Health Facilities, and start to visualize patterns between the two. Graphs and charts are available to see the numbers behind the data.

Explore the Appalachia Data Portal, and more health information tools, at healthlandscape.org.

Department of Education Open Data

Did you know that websites you visit every day, such as weather.com, are powered by open data from government agencies? Large amounts of government data are available on sites like data.gov, but often organizations have difficulty finding the relevant datasets. Open data initiatives like MapED Open Data provide authoritative, ready-to-use data driving many private-sector applications on the web today.

MapED Open Data - Department of Education

Built by Blue Raster, the MapED Open Data site enables citizens to better discover, map, and download NCES and Census datasets in a user friendly way. GIS-users can download data in shapefiles and KMLs. Traditional download formats like excel spreadsheets are also supported. Additionally, developers can find datasets for their applications and access them with the Esri GeoServices REST Spec or GeoJSON.

The site features innovative data filtering and analytical mapping that is approachable by everyday users. Charting capabilities, histograms, and scatter plots can be embedded in other websites, applications, and tools.

Urban Centric Locale Chart Visualization

The site currently features school, district, and state-level data, with additional datasets coming in the next few months. Visit the MapED Open Data site at data.deptofed.opendata.arcgis.com.


Page 2 of 7