In 2014 Blue Raster created a series of maps for Ceres highlighting drought intensity and groundwater depletion as a result of increased hydraulic fracking in shale basins across the United States. Ceres has now produced the Competition for Water in US Shale Energy Development application showcasing the effects and statistics of fracking on both a National level and by water basin.
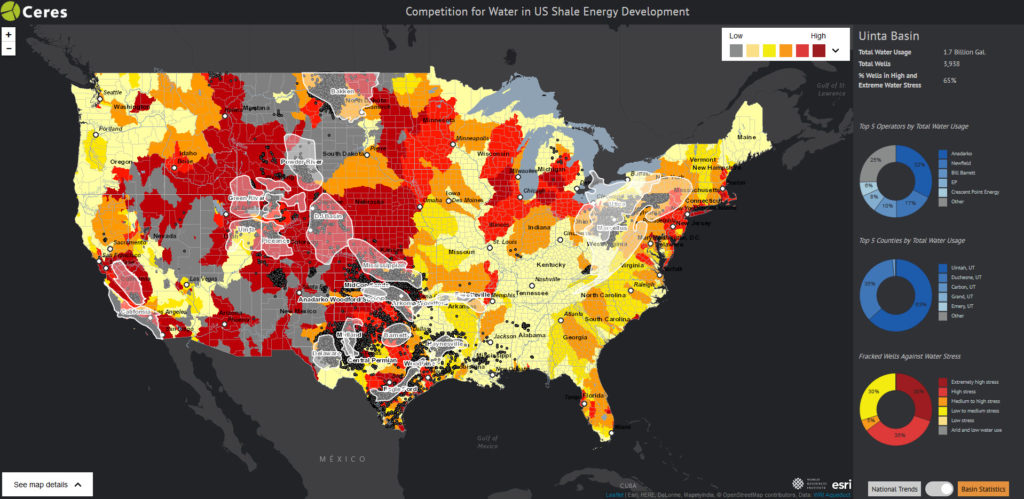
Using information for 109,665 well locations from FracFocus (via IHS) between January 2011 and January 2016, Blue Raster aggregated the total gallons of water usage for 21 basins, and determined the top five operators, states, and counties. Additionally, using data from the Aqueduct Water Risk Atlas from the World Resources Institute (WRI), the percent of wells in areas of high and extremely high water stress is reported. These metrics provide insight into the delicate balance and consequences of water use from fracking against the total water available.
The Competition for Water in US Shale Energy Development application was developed with Esri Leaflet and the ArcGIS JavaScript API.
See the spatial patterns of hydraulic fracking and explore the data today.