Our Work

Blue Raster helps you tell your story through interactive
mapping technology. Make your message clear, exciting,
and user-friendly for both mobile and web platforms.

Tag: species

Measuring Conservation with Biodiversity Dashboard

Every year, billions of dollars are invested in conservation actions across the world. The Biodiversity Indicators Dashboard displays trends in biodiversity, ecosystem services, threats, and conservation actions to help gauge how successful conservation efforts are and how pressures on biodiversity are changing. The Biodiversity Indicators Dashboard is a collaborative effort between Blue Raster and NatureServe technical, scientific and design teams.
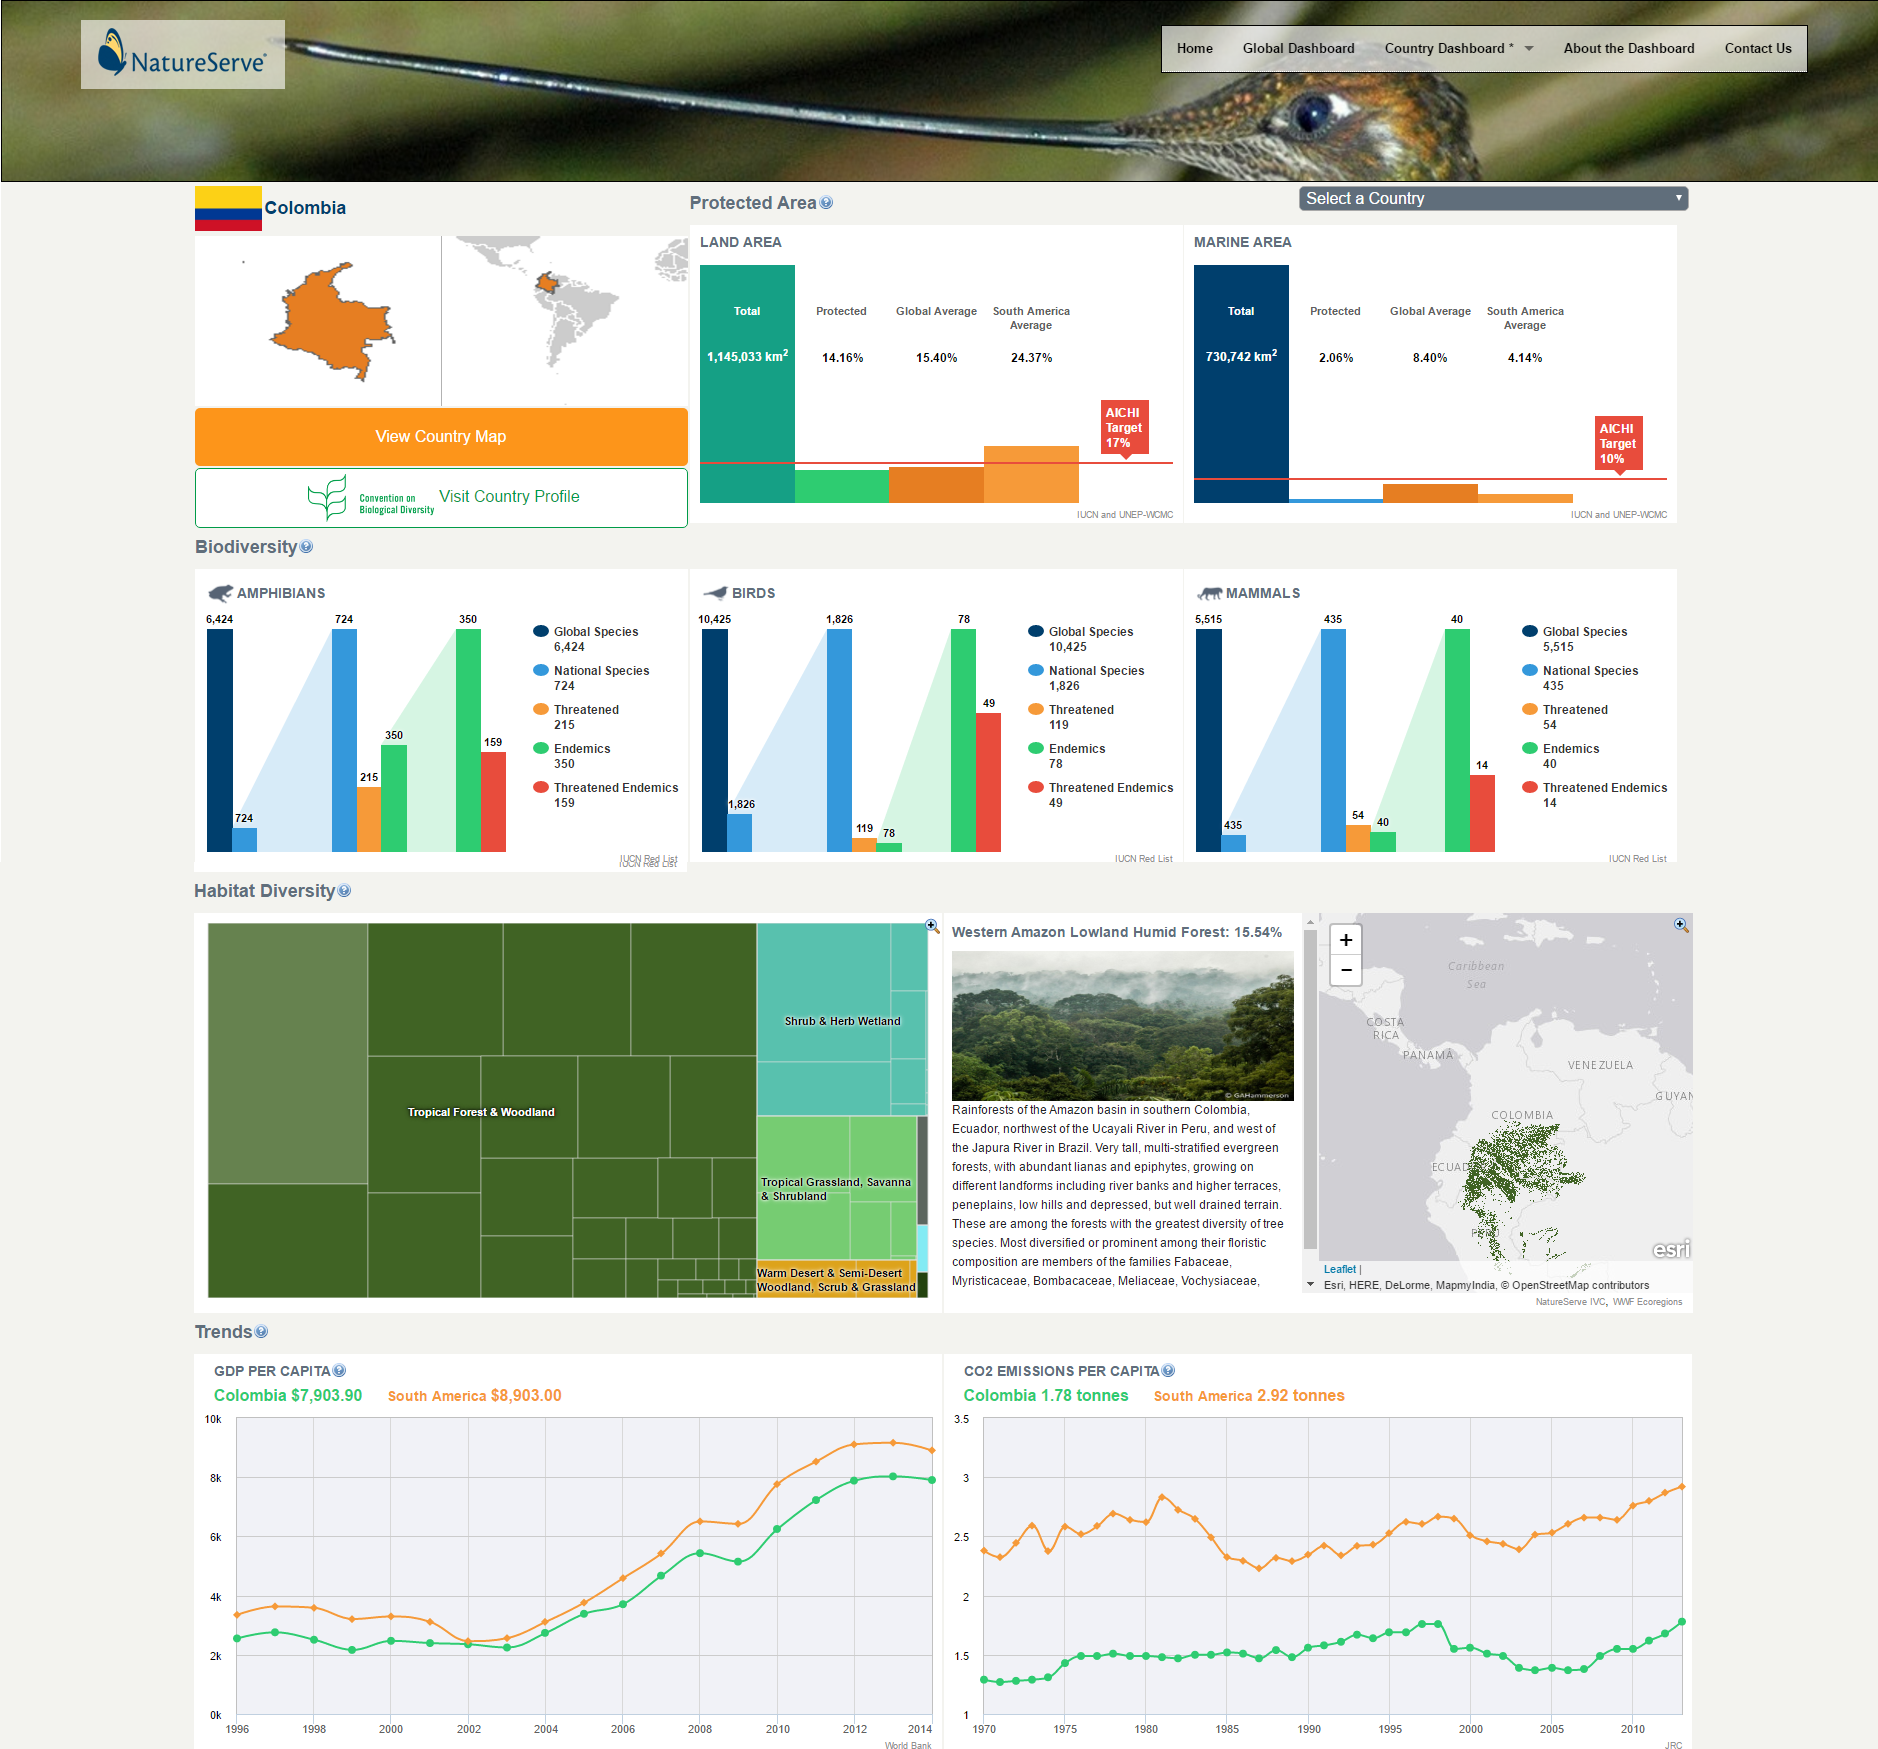
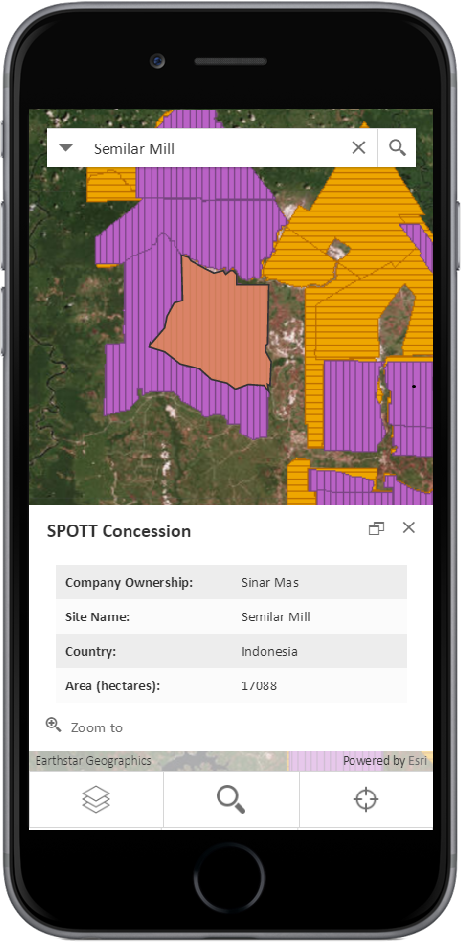
Users can get a snapshot of various indicators for dozens of countries including:
  • Protected Lands
  • Endemic Species
  • Threatened Species
  • Habitat Diversity
  • CO2 Emissions

The dashboard leverages Drupal, HTML5, Esri Leaflet and D3 to bring users an informative mix of data and visualizations.

In 2016, Blue Raster was a proud sponsor of the Society for Conservation GIS (SCGIS) annual meeting- pictured here are Blue Raster’s Phil Satlof and Dr. Healy Hamilton, Chief Scientist at NatureServe and President of SCGIS.

London Zoo and Sustainable Palm Oil

The Zoological Society of London (ZSL) has devoted its efforts to wildlife conservation in Britain and around the world for over 180 years. At the upcoming Roundtable on Sustainable Palm Oil (RT14), ZSL will present a new release of their Sustainable Palm Oil Transparency Toolkit (SPOTT), a project they began two years ago with help from Blue Raster.

The toolkit provides a set of practical tools and information that help stakeholders in the palm oil supply chain monitor and manage the environmental and social risks of palm oil production. An interactive map, created by Blue Raster, allows users to overlay palm oil concessions with relevant environmental data. The upgraded version of this map features new data sets, including:

  • RSPO certified and FoodReg palm oil mills (WRI)concessions_mobile
  • GLAD tree cover loss
  • Intact forest landscapes
  • Peat lands
  • BirdLife Endemic Areas
  • Orangutan habitat
  • Tiger habitat

The map is capable of location search by address, coordinates or decimal degrees and layer search by concession type. It has a responsive design for use on mobile and tablet devices and has been updated with the latest Esri JavaScript, version 4.1. Check out the application here to explore the palm oil industry and learn more about its environmental impacts.

We have worked closely with Blue Raster since 2014 to develop the SPOTT map, bringing together the most relevant data from Global Forest Watch and other platforms, and linking them directly to our corporate transparency assessments… Next year, we are expanding SPOTT to assess companies with operations in other commodities, starting with timber, pulp and paper, so the next phase of development will see even more data and functionality added to the SPOTT map from GFW and elsewhere.

Alexis Hatto, Engagement Manager for ZSL’s Business and Biodiversity Programme


Page 1 of 6