Amazon Web Services

Virtualizing ArcGIS in the Cloud

Blue Raster helps clients achieve rapid, cost-effective cloud solutions for server and application hosting. Our team is now taking this concept a step further to completely Virtualize your ArcGIS Environment. As an Amazon Web Service and Microsoft Azure partner, our team strives to understand the latest ways to use GIS systems more efficiently.Amazon Web Service Partner

Coupled with ArcGIS Pro, an application which handles licensing completely in the cloud, our team has been able to provide full GIS work spaces for several organizations. Our team works with a variety of cloud hosting options including AWS WorkSpaces, AWS AppStream, and Azure Virtual Desktops, each of these options providing a variety of benefits:

  • Removes Operating System requirements
  • Eliminates the need for high performance hardware
  • Offers scalable solutions for organizations with many software users
  • Utilizes the ArcGIS Pro Parallel Processing capabilities, allowing multiple CPU, cores, or processes to work on a large job at the same time
  • Provides more cost efficient solutions for long running, highly intensive workflows

Blue Raster is working with the Natural Resource Defense Council and the Demographic and Healthy Surveys Program to build all encompassing cloud environments. The pilot cloud environment Esri ArcGIS Pro Cloud 
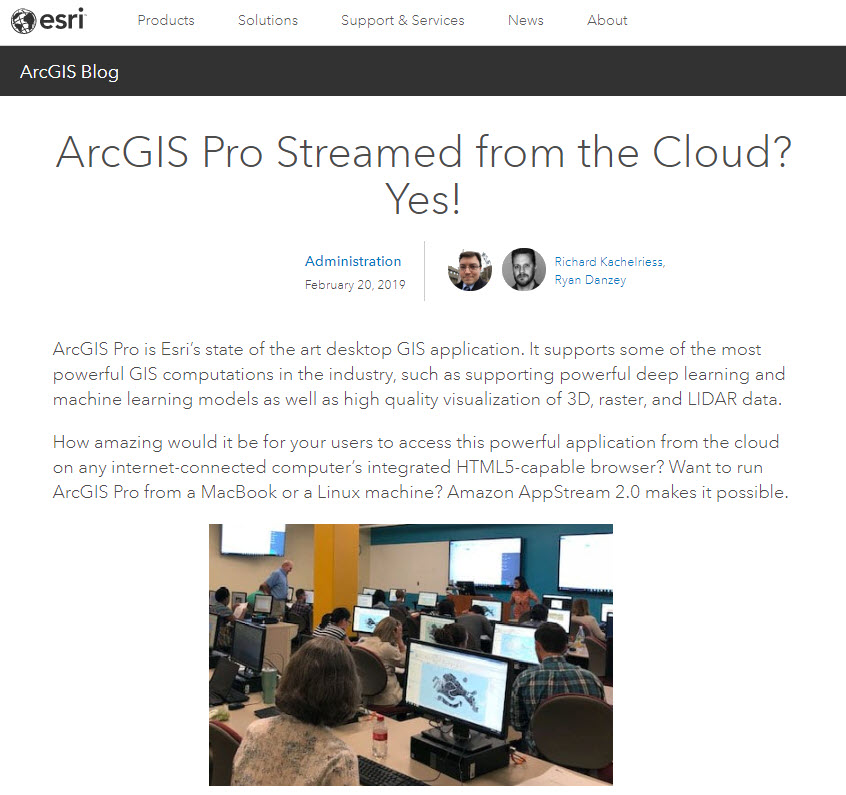
hooks into existing systems and caters to the needs of the organization. For example, the addition of Amazon FSx and Attached Storage to easily share files from a local, network, or virtual desktop drive. Our team can also integrate these work spaces with previously existing Active Directory and Single Sign On (SSO) technologies for large-scale, organizational access.

Ben Mayala, the Senior GIS Coordinator at the Demographic and Health Surveys Program, has been using his Amazon Web Service WorkSpace to run complex, statistic and spatial analysis which was not only taking days to complete, but completely using up machine resources while doing so.

"So far the WorkSpace is really good. It's loading the Geospatial Covariates super fast, data extractions are super fast, and I've already gotten through over half my work" 

Ready to find out more?

Contact us today to learn about ways we can make the cloud work for you.
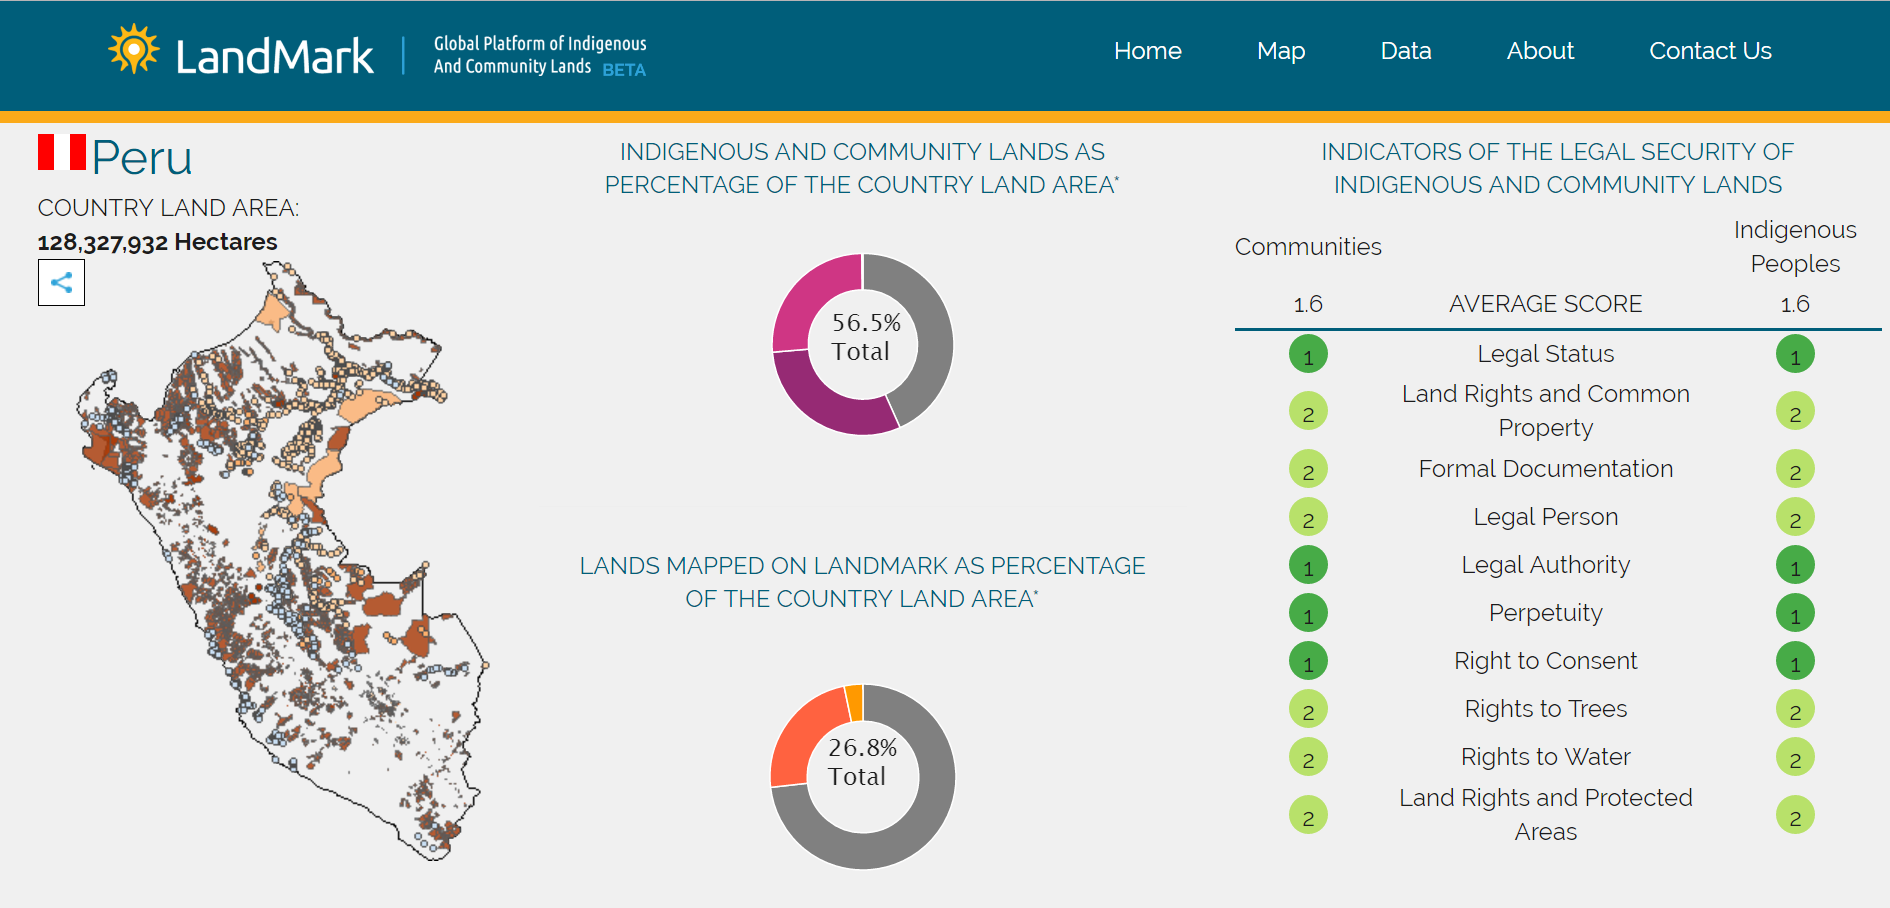
GFW Pro: Managing Deforestation Risk in Commodity Supply Chains

Blue Raster is proud to announce the launch of Global Forest Watch Pro beta, a decision support tool that empowers companies to monitor their supply chains for deforestation and fires with a focus on preserving the most sensitive landscape types. Companies can upload all of their of sourcing areas, farms, and supply sheds for analysis and view interactive maps and diagnostics displaying occurrences of deforestation, alerts for forest fires, land cover types. Each organization is provided a secure location to manage user access to their areas of interest to ensure that the right people are able to interact with the right data at the right time.

GFW Pro quote

Analyzing Areas of Interest

The public launch builds on the features available during the preview period and dramatically increases the speed of analysis of the user's areas of interest (AOI). Upon upload, the AOIs enter the analysis workflow which leverages AWS Lambda to calculate area-of-intersection with a variety of land-use and land-cover datasets. These intersecting areas are analyzed for tree-cover-loss since 2000, providing a detailed and nuanced view of conditions on the ground. With the latest iteration, Blue Raster leveraged AWS Dynamo DB to improve processing speeds by 700%, allowing GFW Pro to analyze hundreds of thousands of locations per day.

Improved Features

The latest update also provides users with an improved ability to manage locations within their account including:
- Sharing functionality to manage access to AOIs within an organization and send data to users outside the organization in the case of supply chains that include several companies
- Allowing users to re-analyze their AOIs at a click of a button if underlying data re updated
- The ability to upload locations in more geographic projections

Detailed Views

GFW Pro provides an unprecedented ability to view detailed environmental diagnostics of any Area of Interest (AOI) in a supply chain. The Forest Change Diagnostic presents a detailed breakdown of all deforestation since the year 2000 by a variety of global and regional specific land-use and land-cover types, such as WDPA Protected Areas, Peat, and Primary Forest. All data are displayed in intuitive interactive charts and are available for download. As Palm Oil Production is a major driver of deforestation, the Commodity Risk Diagnostic allows users to compare deforestation and fires within mills' supply sheds and empowers them to move palm sourcing away from the riskiest mills.


On the GFW Pro map, users have the option to view their data in the form of immersive, full-screen maps which highlight the geographic extent of surrounding environmental conditions. Additionally, users can sort this data by toggling numerous interactive layers, which are conveniently organized by categories such as forest change, land cover, land use, conservation, and more. It is also possible to monitor the conditions of distinct governmental units (such as states and provinces) or unique user-defined areas (through the polygon-drawing tool).

GFW Pro map

GFW Summit & Beyond

We are extremely proud of our work with Global Forest Watch and we look forward to attending the GFW Summit in this week in Washington, DC. We hope that this program advances supply chain management in the context of a changing natural environment, and that our users are better able to comprehend the human footprint of production across the world’s forests. Please check back soon for ongoing improvements to this application, as well as the release of other new and innovative mapping solutions.

Towards Zero Deforestation with GFW Pro

Hundreds of companies around the world have signed on to the United Nations (UC) Sustainable Development Goal (SDG) 15: Life on Land and pledged to work towards zero deforestation by 2020. However, meeting these commitments requires the ability monitor deforestation throughout their supply chains. Global Forest Watch Pro provides each organization a unique, secure environment to monitor and analyze these supply chains, and also helps these organizations demonstrate compliance with commitments and policies.

The application builds on the success of past GFW initiatives and leverages the comprehensive list of authoritative datasets curated by the World Resources institute. Data are served to the application from a variety of locations, such as ArcGIS Server, Amazon S3, and Carto DB. Users can upload lists of over 1,000 custom Areas of Interest (AOIs), which are quickly analyzed for deforestation on sensitive areas and by regional landcover types.  The application’s two diagnostics provide detailed historic deforestation measurements as well as industry specific risk scores. In addition, an alert dashboard provides real time monitoring capabilities and displays the latest GLAD Deforestation and VIIRS Fire alerts.

Supply Chain Analysis for Deforestation


GFW Pro leverages AWS Lambda to provide the intensive computational resources needed to quickly analyze these large custom lists while keeping costs as low as possible. Using the latest serverless technology, the application is quickly able to spin up as much compute power as needed to analyze each list, and then shut them down just as quickly. This allows the application to scale horizontally and processes thousands of user uploaded locations a day.

We are excited to see the impact GFW Pro will have on monitoring environmental impacts and global supply chains.

Conserve and Protect with The Land Trust Alliance

Since 1982, the Land Trust Alliance has supported conservation by providing its over 1,000 member land trusts with education programs, legal insurance, and a voice in Washington speaking for conservationists. With the Find a Land Trust Map, the Alliance gives individuals around the country a means of identifying local organizations working on conservation.

The Land Trust Alliance set out to update the map with a modern, intuitive user interface while maintaining the previous map’s search and filter functionality. Blue Raster’s design team worked through several rounds of design and conducted user testing to ensure that users would be able to quickly find land trusts in their area. By including key information about protection priorities, acres under protection, and Accreditation status, the map makes it easy to find the right land trust.

Members can update the status and information associated with each Land Trust easily. Blue Raster used the latest technology to grab user submissions daily by running a, automated Lambda script hosted on Amazon Web Services and publishing updates to the data hosted on ArcGIS Online.


Helping Secure Land Rights With LandMark

Blue Raster is proud to announce a major update to the LandMark interactive global mapping platform of community and indigenous lands. The original LandMark platform provided unprecedented information about the location of indigenous and community owned lands and the strength of legal protections available to these communities. The latest release builds upon that success by adding new functionality, upgrading back end processes to keep pace with latest technologies, and refreshing the design for an even better user experience. Working closely with the World Resources Institute (WRI) and a 13-member Steering Group, Blue Raster incorporated additional analysis capabilities, redesigned the map layout, added Python scripting to increase processing speeds, and integrated Amazon CloudFront to accelerate application performance.

LandMark Global Platform of Indigenous & Community Lands

We are very pleased to continue working with Blue Raster from the inception of LandMark in 2014 through this latest development phase. Their support has been instrumental in helping us towards our goal of becoming the go-to site for information on indigenous and community land rights globally.

— Katie Reytar, Senior Research Associate, WRI

The map’s new legend and navigation pane provide an intuitive and user-friendly way to explore indigenous & community land maps, country statistics, and legal security for these lands. The updated print function enables users to customize map views and export to a pdf, jpg, or png. Users can also generate location-specific reports by uploading shapefiles or drawing a polygon on the map. These reports include statistics on documentation, identity, and legal recognition of indigenous and community lands. Analysis is performed on the fly and the results can be exported for further study.

The ArcGIS JavaScript API, Highcharts, React JS, Python, and ES6 power the reports and mapping application. Be sure to visit the updated LandMark site today!

Peru Country Profile Page


Page 3 of 4