Tag: Flex API

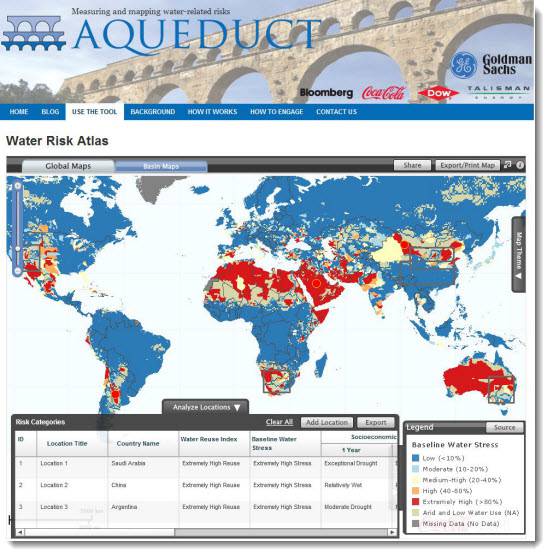
Aqueduct Atlas Helps Project Water Risks

As the world’s rapidly growing population places increasing stress on global water resources, companies and investors are paying closer attention to water use and water risk management.  To help  understand and manage  exposure to geographic water risks, the World Resources Institute (WRI) and its partners are working with Blue Raster to launch the Aqueduct Water Risk Atlas.  Coca-Cola donated maps and data developed to help in understanding and managing exposure to water risks in facilities globally.  Through Aqueduct this information has been made accessible to the public in an interactive, easy-to-use platform, providing a comprehensive and credible metric for measuring geographic water risks.  The Aqueduct Atlas can create high resolution maps of water risks tailored to your unique risk exposure profile.

This interactive application, built using ArcGIS Server, helps companies to quantify and map water risks on a local scale and project future water use and availability.  The current mapviewer includes the Yellow River basin in China.  In the future, the Water Risk Atlas will analyze risk for a wide range of sectors and river basins including the Murray-Darling, Orange-Senqu, and Colorado River basins.

Using the Water Risk Atlas, users can generate detailed, multi-variable maps by adjusting the weight and priority of various factors, including risks related to water scarcity, deteriorating quality, increasing prices, poor water governance, or increasing competition for water resources.  The Atlas can be used to model what-if scenarios, identify risks and opportunities , and share water risk information.  To learn more, visit the water risk mapping platform at http://www.wri.org/our-work/project/aqueduct.

Aqueduct - The Water Risk Atlas

WRI Tracks Nutrient Pollution in Coastal Waters

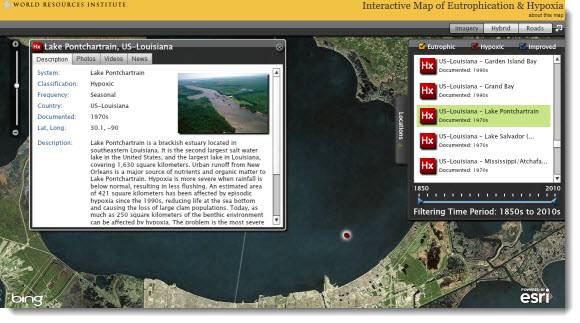
When the World Resources Institute (WRI) wanted to draw attention to nutrient pollution of coastal waters, they turned to Blue Raster to develop an interactive website and GIS application to depict and track this growing problem.  The central feature of the WRI’s Eutrophication and Hypoxia: Nutrient Pollution in Coastal Waters website is an interactive map, which combines geographic, environmental, and time-lapse data.

Within the past 50 years, eutrophication—the over-enrichment of water by nutrients such as nitrogen phosphorus—has emerged as one of the leading causes of water quality impairment.  Eutrophication can result in hypoxia (or oxygen depletion), which can destroy aquatic life and create dead zones in coastal regions. “Until now, a lack of information and monitoring has been a major impediment to understanding the extent and impacts of ‘dead zones’ and eutrophication in coastal ecosystems,” said Mindy Selman, senior water quality analyst at WRI.  “This website is an important step forward because it compiles the current information into a central location to raise awareness and offer solutions for controlling nutrient pollution.”

Blue Raster developed the user-friendly application using ArcGIS Server and Flex API to create a comprehensive look at historical and recent eutrophic and hypoxic events around the world.  The interactive map allows users to investigate 762 coastal areas around the globe that have been affected by eutrophication and hypoxia. The data, which was compiled by analysts at WRI and the Virginia Institute of Marine Science, includes 479 sites identified as experiencing hypoxia, 55 sites that once experienced hypoxia but are now improving, and 228 sites that experience other symptoms of eutrophication, including algal blooms, species loss, and impacts to coral reef assemblages.

Using Flickr, YouTube and Delicious, Blue Raster provided users with the ability to access and share other resources on eutrophication and hypoxia, including publications, photographs, and video.  The site also allows users to provide updates to the maps and databases based on their knowledge of local coastal water conditions. To learn more, please visit WRI’s website on nutrient pollution in coastal waters.


Page 4 of 10