ArcGIS Image Extension for Server

Visualizing Evolution of Atmospheric Deposition

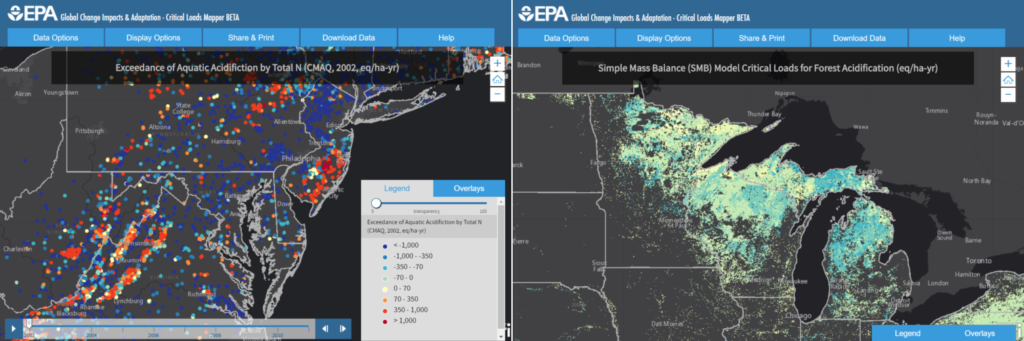
Blue Raster launches the Critical Loads Mapper for the Environmental Protection Agency, the latest tool in a collection of EPA’s Global-Change-Explorer platform. This interactive web application analyzes atmospheric deposition from Nitrogen and Sulfur. Despite abundance in atmosphere and aquatic ecosystems, an excess of Nitrogen can cause significant environmental and health issues, leading to economic impacts across communities. Sulfur, when compounded to form various Sulfur Oxides, can cause health and respiratory problems, damage foliage, and create haze. Working with EPA, Blue Raster created a consolidated source of information, allowing the study of these elements within our ecosystem across a variety of models and timelines.

EPA’s Critical Loads Mapper incorporates a collection of four different respected scientific research efforts, including the National Atmospheric Deposition Program (NADP),  the Community Modeling and Analysis System (CMAQ), Total Deposition Science Committee (TDEP), and the Fifth Assessment Report (AR5) from the Intergovernmental Panel on Climate Change (IPCC). Each group of deposition estimates offers information on a variety of time spans, with some as early as 1851. Concentrations of these pollutants are predicted in deposition models which can help us better understand ecosystems at risk for exceedance of Nitrogen and Sulfur pollution.

In the application, you can overlay Federal lands and Wilderness areas from the Fish and Wildlife Service, National Park Service, and the US Forest Service. In our next release, users will be able to generate Deposition and Exceedance Profiles specific to each area.

With over 500 display options, the Critical Loads Mapper makes it easier for researchers, policy makers, and public officials to access this data, and create styled maps that can be saved, exported, or printed directly from the browser.

The Critical Loads Mapper is optimized to run at high performance, and leverages the ArcGIS Image Server for raster visualization and analysis. In addition, the application is built using Knockout, a JavaScript library that renders JSON (data) objects into html, for a simpler and more dynamic user interface experience. HTML5 Canvas, an html element, is the backbone for all of the on-the-fly printing capabilities. Each component of the application works to support the immense data being supplied while providing a user interface and user experience that is easily navigable and reliable.

Staying Ahead of the Global Water Supply Shortage

Global water supply is rapidly becoming a topic that crosses international borders and stretches across watersheds, communities, and livelihoods. Well known organizations such as the United Nations, the World Wildlife Foundation and The Water Project all recognize the threat of water shortage on generations to come and that these threats will have effects far beyond environmental. These organizations estimate that:

With a clear motive and call for action, World Resources Institute and Blue Raster teamed up to create Global Forest Watch Water, allowing users to quickly identify risks to clean water in areas of deforestation, forest fires and soil erosion and to identify cost-effective natural infrastructure solutions. This public facing tool provides the means for governments, businesses, financing, institutions, and communities to create a plan for action that is educated, sustainable, and effective.

Jasmine

“Global Forest Watch (GFW) Water is a global mapping tool and database that examines how forest loss, fires, unsustainable land use and other threats to natural infrastructure affect water security. Users can drop a pin anywhere on the map to see the risks to nearby water supplies and find resources on how investing in natural infrastructure protection can help alleviate these threats. GFW Water looks to help downstream utilities, businesses, financing and development institutions, researchers and civil society groups quickly identify risks to ample, clean water by providing the data they need for all 230 global watersheds in an easy-to-use, accessible format.”
– Jasmine Qin, Research Analyst, World Resources Institute


The World Resources Institute is partnering with civil-society organizations to support on-the-ground results, using GFW Water information to help them secure clean water supplies. These partners include:

GFW Water leverages the Esri ArcGIS API for JavaScript and ArcGIS Image Extension for Server for its advanced mapping capabilities and the ability to produce on-the-fly analysis for selected water features. The full reports include risk scores for forest loss, erosion, fires, and baseline water stress, as well as number of water intake locations, the presence of dams, and more. The application incorporates the Esri Hydrology Service, which allows for upstream analysis as a user specifies a point placed on a map. ReactJS and Highcharts are used for enhanced user interface features including the incorporation of animated charts and graphs.


Fires in Indonesia Park seen with GFW Fires App

The World Resources Institute’s (WRI) Global Forest Watch Fires is currently being used to respond to a massive outbreak of fires in Tesso Nilo National Park, Indonesia. The fires in the protected area began May 29, 2015 and have continued to burn since.

In response, Blue Raster created the maps below using ArcGIS Online and a custom application to analyze the region where fires are burning. Using 50 centimeter resolution imagery along with NASA MODIS fire data, the maps capture the illegal activity occurring within the boundaries of this protected land. GFW Fires continues to be used as a response tool in Tesso Nilo and other parts of the world.

Check out the maps, and visit GFW Fires to see the latest on this outbreak.

Fires in Tesso Nilo National Park


Page 3 of 3