Water

WRI: New Agricultural Exposure to Water Stress map

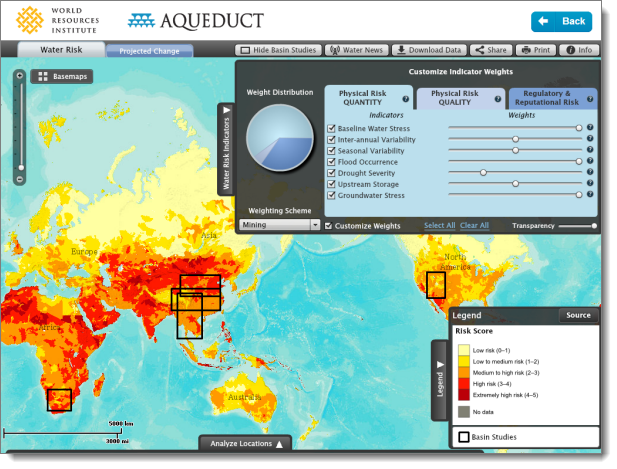
Blue Raster recently worked with the World Resources Institute (WRI) to build the Agricultural Exposure to Water Stress interactive map which highlights the intersection between 20 commodity crops, from coffee to cocoa to oranges, with different levels of baseline water stress.

WRI describes water stress as “the ratio of total water withdrawals to the available renewable supply in an area. In highly water-stressed regions, 40 percent or more of the supply is used annually. When that ratio gets up to 80 percent, it’s considered extremely stressed.”

Agricultural exposure to water stress

The new series of maps designed by Aqueduct analyst, Francis Gassert, reveals where crops are grown in areas of high competition for limited water supplies and shows that 56% of irrigated agriculture face high water stress. The tool allows users to zoom to areas of irrigated and non-irrigated farm land around the world and visualize where the demand for water is greatest. With water demand forecasted to increase 50% by 2030 due mostly to agriculture, the tool helps show the urgency of finding sustainable means for food production.

Coverage of the Aqueduct Commodities Interactive Map appeared in Energy & Environment (subscription) and Salon, among others.

Guerrilla Gardening- Baltimore Crowdsourcing Map

Blue Raster enabled BNIA-JFI (Baltimore Neighborhood Indicators Alliance-Jacob France Institute) to setup and launch their new interactive map for community gardens and open spaces in Baltimore with ArcGIS Online Accelerate. The Interactive Map of Community-Managed Open Space assists city residents in discovering natural spaces they can protect, claim, and effectively use for their community in an urban location. Take a look at this video to see the site in action. The site also allows users to search by address or garden, view gardens by categories and submit pictures.

Interactive Map of Community Managed Open Space

Seema D. Iyer, associate director of the Jacob France Institute at the University of Baltimore’s Merrick School of Business, said that the website will help communities and community-based organizations visualize where greening efforts have been occurring as they work to coordinate resources:

“BNIA-JFI utilized Blue Raster’s ArcGIS Online Accelerate program to help launch an online mapping platform for data that we integrated from five different organizations with overlapping information.  Blue Raster quickly understood our technical needs, met our aggressive timeframe, helped us build our own internal capacity to maintain the site, and provided professional advice on how to augment the site in the future.  We look forward to working with them again.”

ArcGIS Online and Flickr API allowed five different organizations – Baltimore Green Space, Parks and People, Master Gardeners, the Johns Hopkins Center for a Livable Future and Baltimore City’s Power in Dirt project – to aid governmental and non-governmental agencies synchronize “greening activities”. The Interactive Map of Community-Managed Open Space is helping local groups across the city preserve uncluttered space.

Aqueduct – Mapping Water Risk Around the Globe

Blue Raster and the World Resources Institute (WRI) recently launched the latest version of Aqueduct Atlas, helping businesses around the world understand the impacts of a sustainable water supply.

The platform creates customizable, multi-variable maps that display twelve indicators of water risk in a given area, including groundwater stress levels, drought intensity, and flood occurrence. It also considers less obvious risks like legislation and regulatory limits to water access.

This information helps companies, investors, and other decision-makers:

  • Prioritize investments that will increase water security
  • Learn how water stress will affect their operations
  • Assess risk and target new opportunities worldwide

To map their priorities, users can adjust the weight of the water risk variables. The maps also have settings for nine water-intense industry sectors, including energy, agriculture, and chemical. Geocoding allows users to plot facilities, suppliers, and potential new market locations.

Aqueduct Water Risk Atlas

Built on ArcGIS Server 10.1, the tool takes advantage of the new “dynamic layers” capability to allow rapid rendering of more than 25,000 polygons to depict the topology of catchment areas.

Major companies around the world are already using Aqueduct to inform operations:

  • McDonalds is requiring hundreds of its suppliers to use Aqueduct to assess local water risk
  • Procter & Gamble used Aqueduct to understand how water risk may affect its global facilities
  • Bank of America Merrill Lynch used Aqueduct to illustrate water risks and opportunities for investors

“Recent history is littered with companies that failed to anticipate emerging threats. Water scarcity is one such threat,” said Andrew Steer, President of WRI. “Thankfully, forward-thinking business leaders are starting to get it. They understand that water risk is one of the top issues that they face.”

Aqueduct has received extensive media coverage, including in the New York Times, The Guardian, Fast Company, Bloomberg, and Greenbiz.

Aqueduct allows users to easily see water risk around the world. Come check out this new decision-support tool.

Aqueduct Atlas Helps Project Water Risks

As the world’s rapidly growing population places increasing stress on global water resources, companies and investors are paying closer attention to water use and water risk management.  To help  understand and manage  exposure to geographic water risks, the World Resources Institute (WRI) and its partners are working with Blue Raster to launch the Aqueduct Water Risk Atlas.  Coca-Cola donated maps and data developed to help in understanding and managing exposure to water risks in facilities globally.  Through Aqueduct this information has been made accessible to the public in an interactive, easy-to-use platform, providing a comprehensive and credible metric for measuring geographic water risks.  The Aqueduct Atlas can create high resolution maps of water risks tailored to your unique risk exposure profile.

This interactive application, built using ArcGIS Server, helps companies to quantify and map water risks on a local scale and project future water use and availability.  The current mapviewer includes the Yellow River basin in China.  In the future, the Water Risk Atlas will analyze risk for a wide range of sectors and river basins including the Murray-Darling, Orange-Senqu, and Colorado River basins.

Using the Water Risk Atlas, users can generate detailed, multi-variable maps by adjusting the weight and priority of various factors, including risks related to water scarcity, deteriorating quality, increasing prices, poor water governance, or increasing competition for water resources.  The Atlas can be used to model what-if scenarios, identify risks and opportunities , and share water risk information.  To learn more, visit the water risk mapping platform at http://www.wri.org/our-work/project/aqueduct.

Aqueduct - The Water Risk Atlas

WRI Tracks Nutrient Pollution in Coastal Waters

When the World Resources Institute (WRI) wanted to draw attention to nutrient pollution of coastal waters, they turned to Blue Raster to develop an interactive website and GIS application to depict and track this growing problem.  The central feature of the WRI’s Eutrophication and Hypoxia: Nutrient Pollution in Coastal Waters website is an interactive map, which combines geographic, environmental, and time-lapse data.

Within the past 50 years, eutrophication—the over-enrichment of water by nutrients such as nitrogen phosphorus—has emerged as one of the leading causes of water quality impairment.  Eutrophication can result in hypoxia (or oxygen depletion), which can destroy aquatic life and create dead zones in coastal regions. “Until now, a lack of information and monitoring has been a major impediment to understanding the extent and impacts of ‘dead zones’ and eutrophication in coastal ecosystems,” said Mindy Selman, senior water quality analyst at WRI.  “This website is an important step forward because it compiles the current information into a central location to raise awareness and offer solutions for controlling nutrient pollution.”

Blue Raster developed the user-friendly application using ArcGIS Server and Flex API to create a comprehensive look at historical and recent eutrophic and hypoxic events around the world.  The interactive map allows users to investigate 762 coastal areas around the globe that have been affected by eutrophication and hypoxia. The data, which was compiled by analysts at WRI and the Virginia Institute of Marine Science, includes 479 sites identified as experiencing hypoxia, 55 sites that once experienced hypoxia but are now improving, and 228 sites that experience other symptoms of eutrophication, including algal blooms, species loss, and impacts to coral reef assemblages.

Using Flickr, YouTube and Delicious, Blue Raster provided users with the ability to access and share other resources on eutrophication and hypoxia, including publications, photographs, and video.  The site also allows users to provide updates to the maps and databases based on their knowledge of local coastal water conditions. To learn more, please visit WRI’s website on nutrient pollution in coastal waters.


Page 7 of 7