Water

Turning Concept into Reality: Green Infrastructure

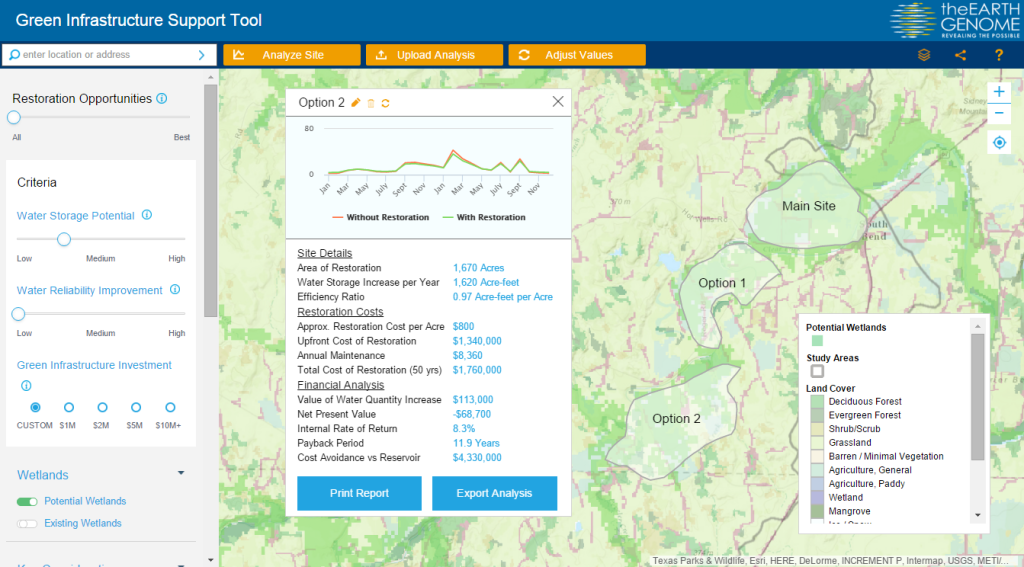
Water is one of the world’s most pressing challenges.  Faced with the opportunity to find better water solutions for global stakeholders, the Earth Genome, backed by the World Business Council for Sustainable Development (WBCSD), enlisted the help of Blue Raster and Arizona State University to create the Green Infrastructure Support Tool (GIST). The interactive web mapping application provides high-level wetland-restoration site analysis and portfolio prioritization to address water scarcity and was recently launched at GreenBiz 2016.

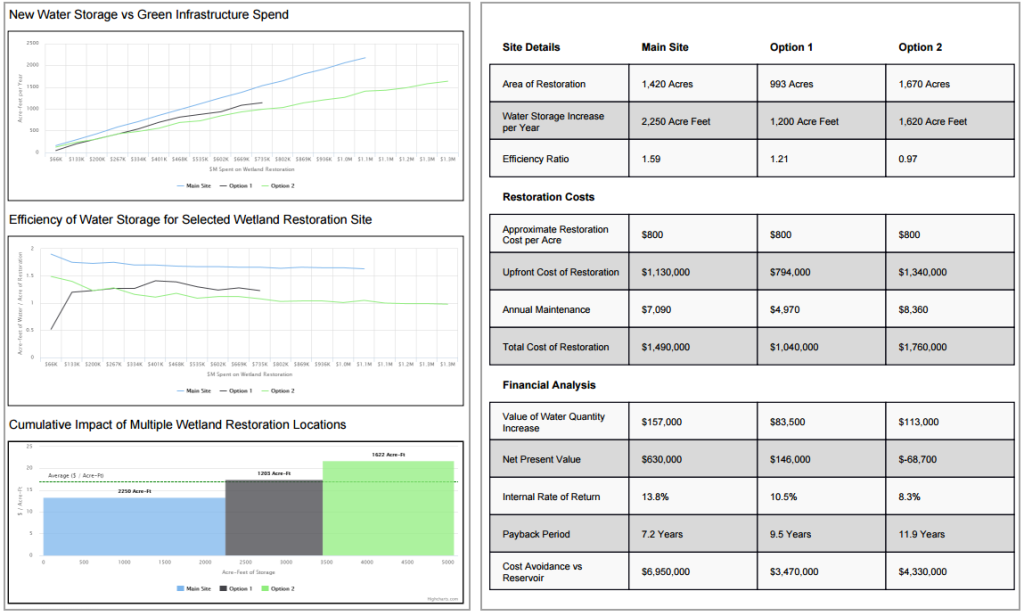
The tool employs criteria-based screening via spatial data and end-user inputs, enabling end users to weigh options across the region and compare relative value and costs. Financial metrics include net present value, area cost curves, and environmental return on investment. Together, they help determine the best “bang for buck” restoration sites to provision water across an entire basin. The application combines environmental data such as wetland areas, biodiversity and land cover with business initiatives that consider both investment and costs for various land-cover restoration options, resulting in a truly spatial decision support system.

GIST Site Definition

Key in the development of GIST was the ability to present data in an easy-to-use way and to incorporate millions of points of disparate environmental data. As a result, corporations, governments, water authorities, resource engineers or anyone interested in potential water restoration are able to create their own development sites with corresponding financial analysis. The reporting engine supports comparing multiple sites, determining the optimal green infrastructure investment, based on landscape characteristics and hydrologic modeling.

GIST Analysis


The ability to create these custom reports is made possible by on-the-fly statistical/histogram calculations leveraging the ArcGIS Image Server extension. The GIST also uses the ArcGIS JavaScript API and Highcharts to supply the data and charting throughout the application.


“Blue Raster was a terrific partner. The Earth Genome exists to unite data, science, visualization and end users to solve some of the planet’s most wicked problems. Blue Raster was essential in pulling off GIST, what we believe is a breakthrough tool that puts environmental data, translated via world class science, into the hands of real decision makers. I’m most pleased with the work Blue Raster did on the visual interface. The tool is elegant yet simple: anybody can use it to find the opportunities that make most financial sense for their organization.”

Earth Genome – Glen Low
Co-Founder, The Earth Genome


Unless We Act Now: UNICEF

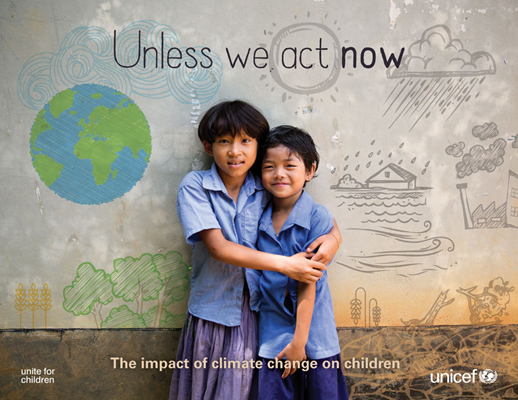
Unless We Act Now ReportBlue Raster is proud to announce a collaboration with The United Nations Children’s Fund (UNICEF) to contribute to Unless We Act Now: The Impact of Climate Change on Children – a report published by UNICEF at the annual Conference of Parties (COP21), also known as the 2015 Paris Climate Conference. COP21 is a renowned conference that brings together international voices representing government and UN Agencies, NGOs and civil society to assess climate change and set universal agreements and goals for reducing climate change and adapting to the changes that have already begun.

The Unless We Act Now report leveraged geospatial analysis of current demographic, environmental and projected climate data, in order to direct aid to child populations across the world as they face unforgiving changing weather patterns.

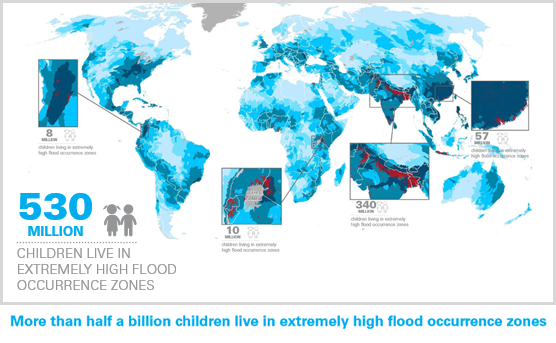
UNICEF has made putting children first their mission, and although climate change is an imminent threat to populations across the world, it is children who are hit the hardest as their bodies are most vulnerable to change. Being able to understand where these 2.3 billion children are was the first step, but taking this further to understand how environmental conditions such as droughts, floods, and extreme heat effect food and water supply, sanitation, and the spread of disease is made possible through GIS analysis via ArcGIS Desktop and ArcGIS Online.

Climate Change affects children in unique ways — these maps show where Children and Climate Change intersect.

unicefMap1COP21 is a fantastic opportunity for UNICEF to present our “Unless We Act Now: The Impacts of Climate Change on Children” report, as climate change will be of critical importance when protecting and preserving the future livelihood of children around the world. Blue Raster was with us every step of the way during the data analysis and cartographic development, and their timely responses, adaptive and analytical methods, and personal connections to spatial data subject matter experts working around the world helped make this project a resounding success.

Nicholas Rees, Policy Analysis Specialist, UNICEF New York

A map poster featuring the analytical and cartographic work was then featured at the 2016 Esri User Conference and won the ICA and IMIA Excellence in Cartography award, and was selected for publication in 2017 Esri Map Book, Volume 32.

“The Impact of Climate Change on Children by UNICEF was recognized by the judges for it’s powerful, stark design on a relevant, topical subject. This work delivered a high impact, strong message with clarity and effective simplicity.”

Esri Insider, July 14, 2016

A special thanks to:
Trevor Croft, DHS Program   |   Paul Reig and Tianyi Luo, World Resources Institute   |   Carmelle Terborgh, Esri
Deborah-Balk, The City University of New York   |   Susana Adamo and Kytt MacManus, CIESIN Columbia University

children

New Mobile-Friendly Water Risk Atlas

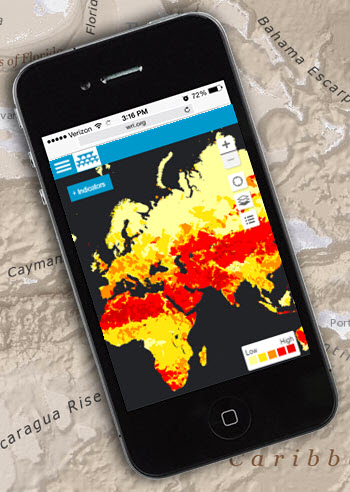
Aqueduct on Mobile PhoneEarlier today, Blue Raster and the World Resources Institute (WRI) released a new version of Aqueduct Atlas, an application helping companies and investors manage exposure to water risks. Launched in 2013, Aqueduct is used worldwide by leading companies, including McDonald’s, Goldman Sachs, and Procter & Gamble. For the first time, the site is optimized for mobile phones and tablets.

The new site enables users to:

  • Assess water stress, supply, and demand in the coming decades
  • Learn where water risks will be most severe under well-known climate scenarios
  • Prioritize investments for projected conditions

Charles Iceland, Director, Aqueduct Project “The World Resources Institute’s Aqueduct team has worked closely with Blue Raster for over three years developing the Aqueduct Water Risk Atlas. Blue Raster has been an invaluable partner in building innovative mapping tools to meet our target audiences’ needs.” 
-Charles Iceland, Director, Aqueduct Project


Features:

  • Global water risk maps
  • Weighing risk priorities:  scarcity, quality, prices, governance, and competition
  • Provides industry presets with sector-specific weighting schemes or define your own
  • Geocode facilities, suppliers, and potential new market locations
  • Export analysis results to Excel

Aqueduct is powered by ArcGIS for Server, ArcGIS JavaScript API, and ArcGIS Desktop. To learn more, visit the platform and see Aqueduct featured in the New York Times, The Guardian, Fast Company, Bloomberg, and Greenbiz.

India Water Tool Offers Strategies for Water Risk

Companies in India are contending with a growing resource crisis: water shortage. With 54% of the country’s total area facing high to extremely high water stress, India is positioned to become one of the most water-stressed countries in the world.

A combination of water-intensive agriculture, increasing industrialization, and business-as-usual approaches to water management has put the water supply in danger. In a report published by the Water Resources Group, the national supply is predicted to fall 50% below demand by 2030. But companies, government agencies, and other water users have a new tool poised to make a meaningful difference, the India Water Tool 2.0 (IWT 2.0).

India Water Tool

Today marked the launch of version 2 of this comprehensive, publicly available online tool. IWT 2.0 was created in partnership by the World Business Council for Sustainable Development (WBCSD), companies, research organizations, and industry associations.


Joppe Cramwinckel
We are proud to have led the development of the India Water Tool. Water is a shared resource with finite volumes, resulting in collective risk. Collaboration is key to developing scalable and impactful solutions and driving their locally-relevant implementation.
-Joppe Cramwinckel, Director, Water, WBCSD


The tool is the most comprehensive freely available resource to help companies, government agencies, and other stakeholders identify their water risks and prioritize water-management sites.

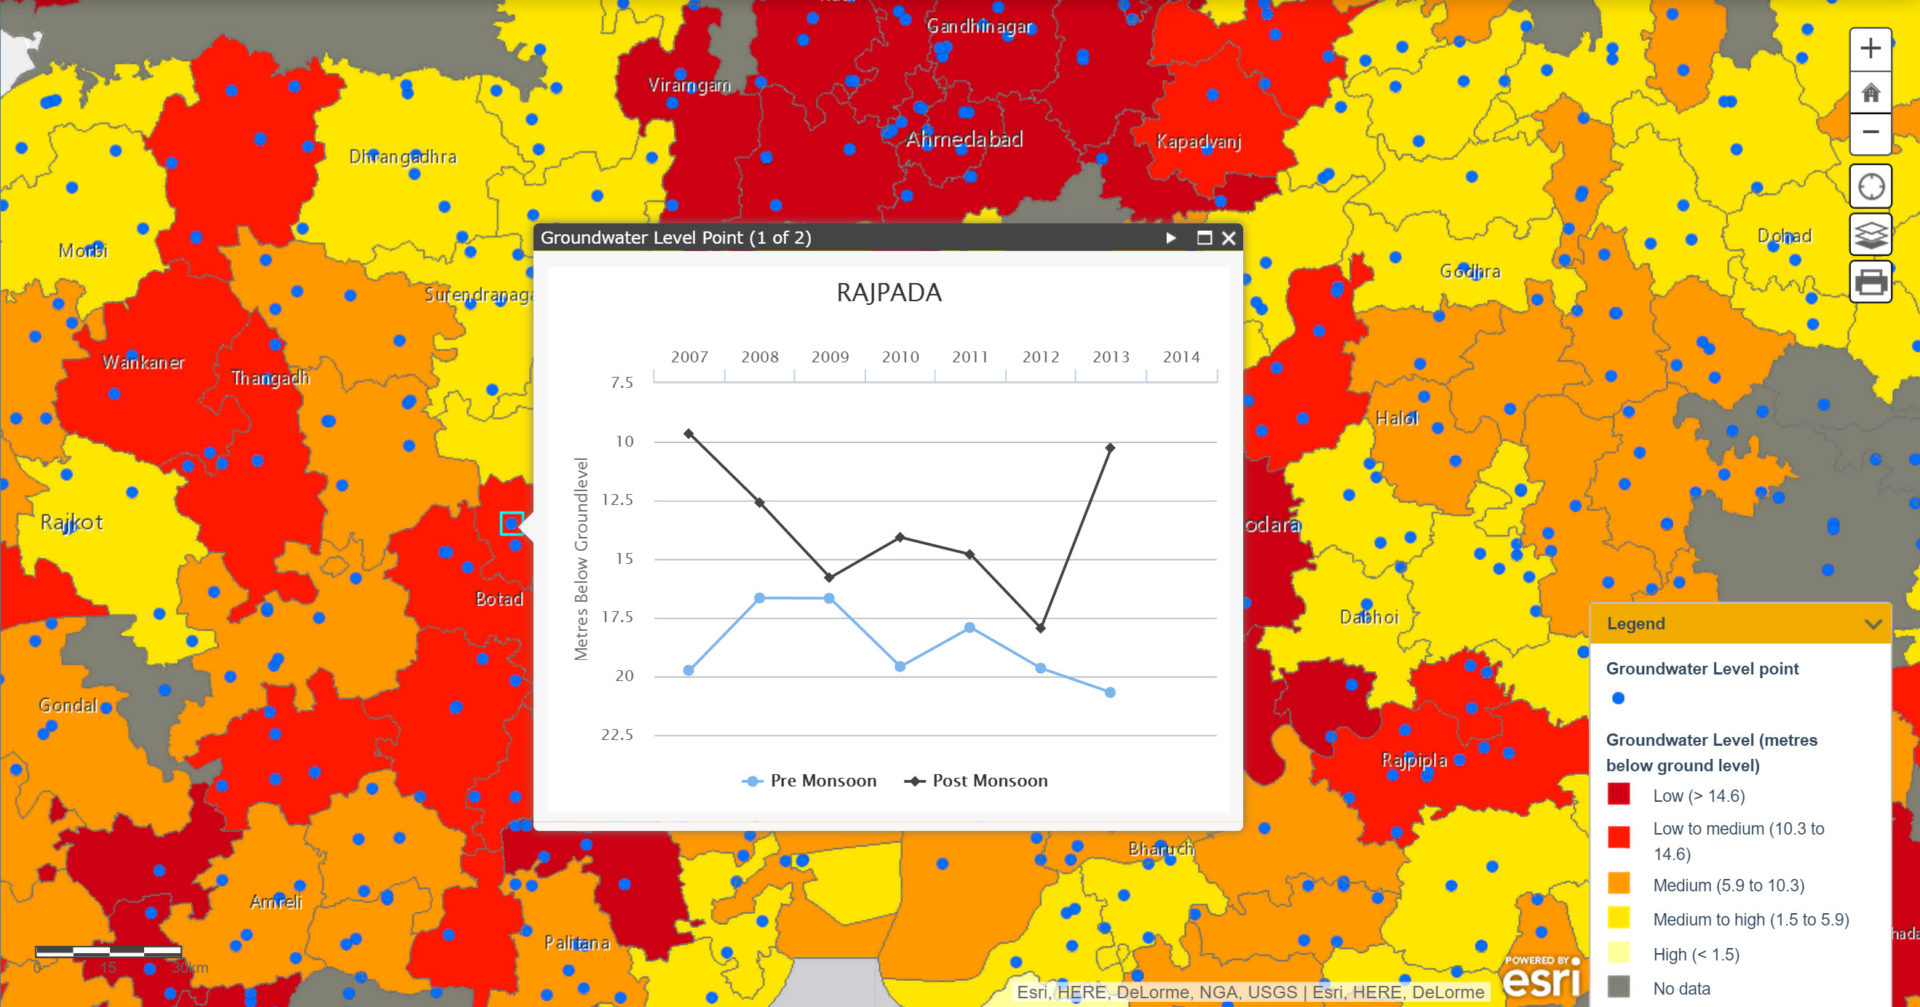
Groundwater_DataVizz

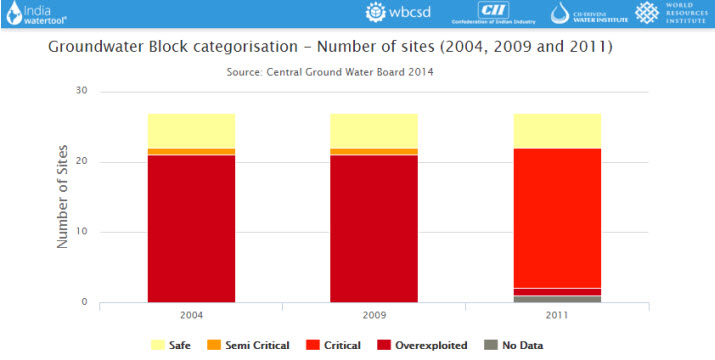
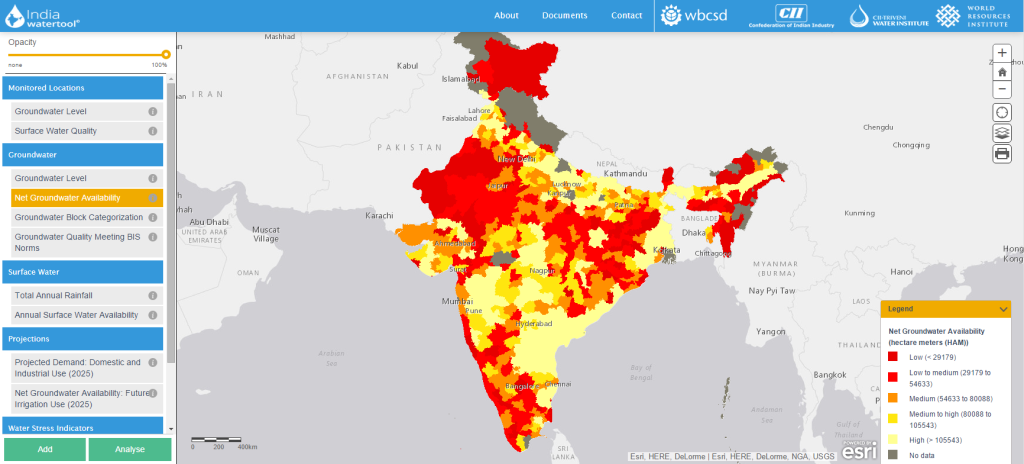
The web platform incorporates a series of interactive maps including groundwater level, rainfall, surface water availability,  projected water stress, and water quality. Users can upload or enter GPS-based locations and receive custom reports featuring charts and graphs quantifying water-risk metrics. Built using the ArcGIS Desktop, ArcGIS for Server, and ArcGIS JavaScript API, the tool allows companies to answer questions including:

  • How many of my sites are in high stress regions?
  • How many of my sites are in over-exploited or critical areas?
  • What is the net groundwater availability and projected demand for groundwater for my sites?
  • Are any sites in areas where the concentration of pollutants are above permissible limits?

India Water Tool 2.0

The tool also addresses the shared risks between agriculture, industry, and domestic users. For example, of the 632 groundwater quality districts captured in the tool, only 59 meet Indian-government water quality safety standards. This equates to more than 100 million people living in areas of poor water quality. Among the 4,000 wells showing statistically significant trends, 54% have declined in the past seven years, and 16% have dropped over 1 meter per year. The map also shows a widespread pattern of high risk in Northwest India, a region where agriculture is a cornerstone of the economy. Producing 50% of the national government’s rice supply and 85% of its wheat, the area depends heavily on groundwater for  these water intensive crops.

IWT 2.0 is the first step for understanding water-related challenges in India and planning for long-term water management. Check out and explore the India Water Tool 2.0 today.

Ceres Maps Analyze Drought and Ground Water Depletion in Shale Development Areas

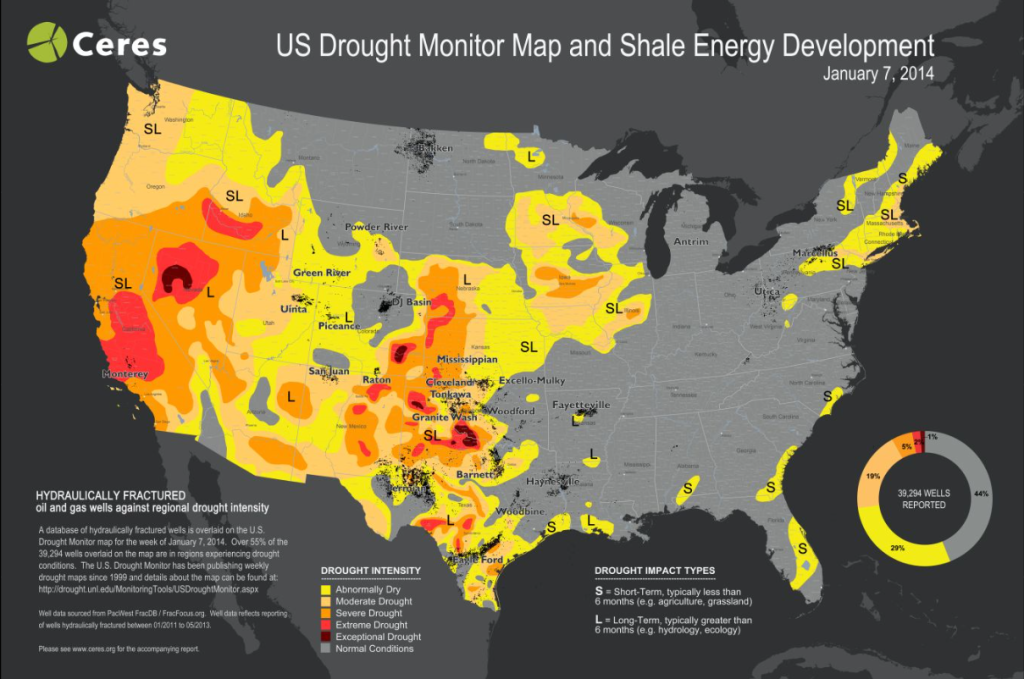
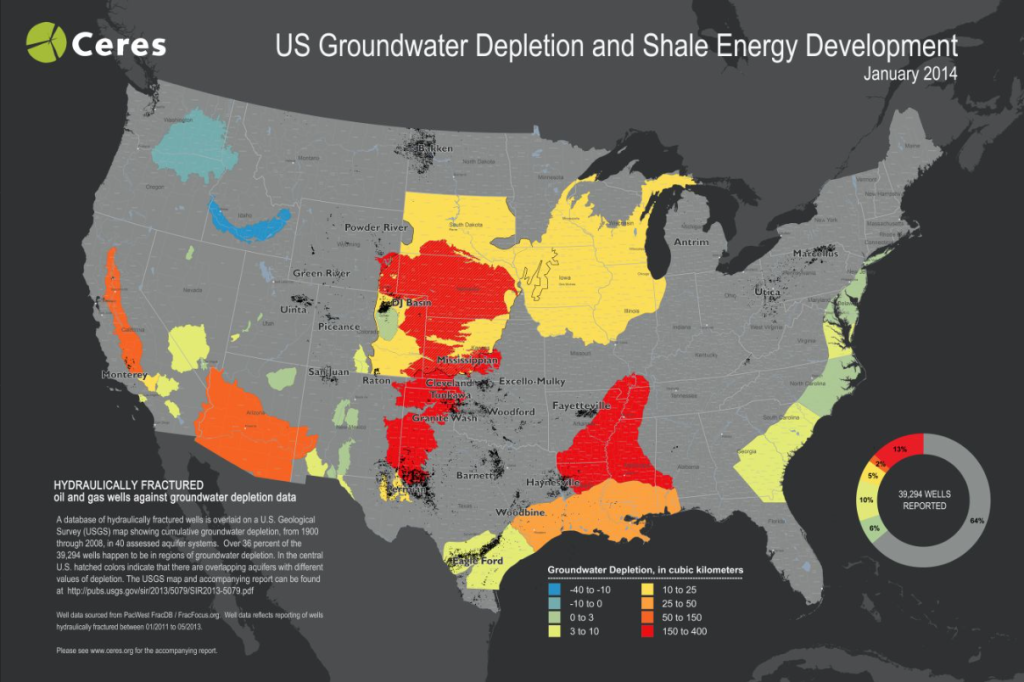
With hydraulic fracturing and horizontal drilling on the rise  in the United States, many regions have become at risk for water availability. To help highlight these areas, Blue Raster created a series of Hydraulic Fracturing & Water Stress maps for Ceres using Esri’s ArcGIS Desktop software and Adobe Photoshop. Through these maps, users can view eight regions of intense shale development in the United States and Canada, and the degree to which these areas are under stress.

Ceres Drought Monitor Map and Shale Energy Development

Featured in CERES’ latest report: Hydraulic Fracturing & Water Stress: Water Demand by the Numbers, the maps provide investors, lenders, and regulators with sustainable recommendations for minimizing their water demands. With more than 55% of U.S. wells located in areas amid drought, and 36% percent in areas experiencing groundwater depletion, the maps serve as resources for ensuring a long term sustainable strategy for industries in shale energy development.

Ceres Drought Monitor Map and Shale Energy Development

To learn more about the project and to view the maps, visit Ceres’ Hydraulic Fracturing & Water Stress page.


Page 6 of 7