Tag: ArcGIS StoryMaps

StoryMaps in the Time of COVID-19: Telling the Story of the Red Cross Response Efforts

While a large portion of the country and world is doing its part to stay indoors during the coronavirus (COVID-19) epidemic, organizations like the American Red Cross continue to provide disaster relief. What do these efforts look like during times of COVID-19? To highlight these efforts, Blue Raster collaborated with the Red Cross to publish a new story map: How the Red Cross is Helping During COVID-19.
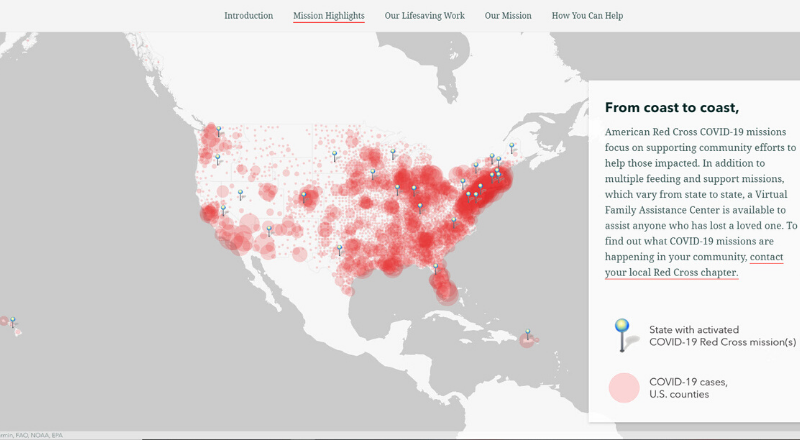
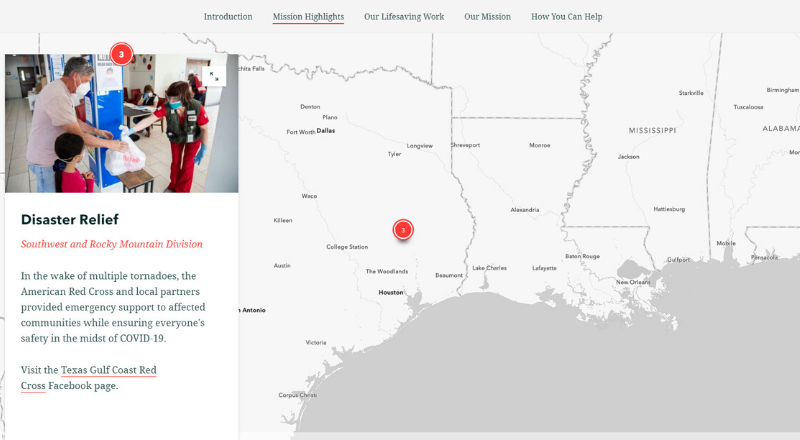
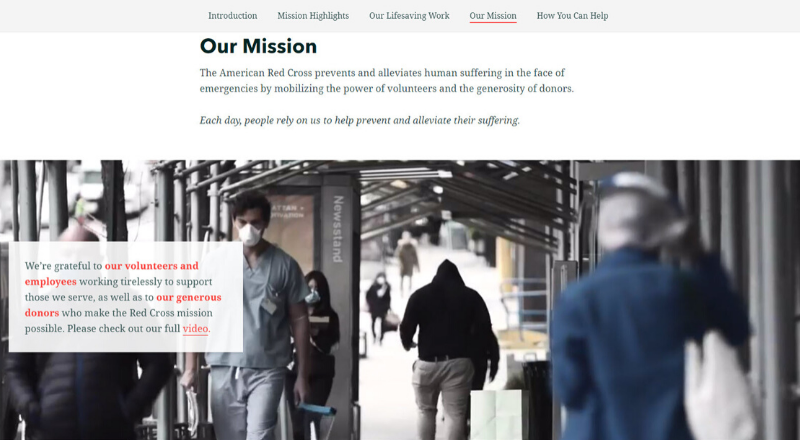
The goal of the story map is to showcase how the Red Cross has shifted its operations while continuing to fulfill their lifesaving work to alleviate suffering despite the pandemic. Additionally, since the coronavirus disease impacts different regions in different ways, the story map highlights what COVID-19 relief missions look like across the country. Just as important, it provides the reader with resources for how to help.

Red Cross StoryMap Details

To portray the significance of the Red Cross’s efforts, Blue Raster leveraged ArcGIS StoryMaps platform. We were excited to configure the new Navigation bar. This allows the read to skip the scrolling and jump to a section of interest. The new floating panel layout for the Sidecar allows the featured photos to tell more than a thousand words. In addition, the Express Map helps highlight the geographic breadth of the Red Cross’s COVID-19 response. Thanks to the photos provided by the Red Cross, the story map provides an intimate look into the interactions between the Red Cross relief teams and those being assisted during a time of strict distancing. View the full Red Cross StoryMap here: How the Red Cross is Helping People During COVID-19

In times of COVID-19, Blue Raster prioritizes helping organizations like the Red Cross tell their story in a meaningful and impactful way. Learn about COVID-10 Response efforts using ArcGIS. We are ready to assist your organization with the rapid setup of ArcGIS platforms that best suit your needs, such as Operations Dashboards, ArcGIS Hub, and Experience Builder, and more.

Contact us today to learn more about how we can assist your organization.

Contact Us

  • This field is for validation purposes and should be left unchanged.

A Look at the Ohio River: Past, Present, and Future

Ohio River

Image is courtesy of the NASA Earth Observatory, using Landsat data from the U.S. Geological Survey. The satellite image captured March 2018 flooding at the confluence of the Ohio and Wabash rivers.

Blue Raster partnered with The National Geographic Society, Lenfest Institute, and seven nonprofit newsrooms on a project entitled, Good River: Stories of the Ohio. The Ohio River runs 981 miles from Pittsburgh, Pennsylvania, to Cairo, Illinois, where it joins the Mississippi. It provides drinking water for five million people, and is also a thoroughfare of business, supporting jobs and communities. But it is also commonly cited as the most polluted river in the United States. For this project, PublicSource and six other participating newsrooms are producing a series of stories about the environment, economy and culture of the Ohio River watershed.

Good River Newsroom Partners

Ohio River StoryMap

To give readers a sense of how big the Ohio River watershed is, Blue Raster created a series of map graphics for the site’s landing page. The maps touch-upon topics including population concentration and impaired waterways. To create the maps, our team used data from the U.S. Environmental Protection Agency (EPA) and leveraged ArcGIS Pro to style the map graphics.

In the series, journalists share the beauty of the Ohio River and threats facing the region. To take readers on an interactive tour of the Ohio River, Blue Raster produced a StoryMap called Highlights of the Ohio for the project launch. The StoryMap features points of interest along the river and the watershed region.

The Good River News Partners will be publishing multiple stories from November 2019 through January 2020. To follow along with the project and share stories or questions, text OHIO to 412-528-6575. Additionally, you can follow #OhioRiverStories on social media.

Good River: Stories of the Ohio is a series about the environment, economy, and culture of the Ohio River watershed, produced by seven nonprofit newsrooms. To see more, please visit ohiowatershed.org.


To learn more about StoryMaps, you can start here.


Page 4 of 6