Tag: Responsive Design

Aqueduct – Mapping Water Risk Around the Globe

Blue Raster and the World Resources Institute (WRI) recently launched the latest version of Aqueduct Atlas, helping businesses around the world understand the impacts of a sustainable water supply.

The platform creates customizable, multi-variable maps that display twelve indicators of water risk in a given area, including groundwater stress levels, drought intensity, and flood occurrence. It also considers less obvious risks like legislation and regulatory limits to water access.

This information helps companies, investors, and other decision-makers:

  • Prioritize investments that will increase water security
  • Learn how water stress will affect their operations
  • Assess risk and target new opportunities worldwide

To map their priorities, users can adjust the weight of the water risk variables. The maps also have settings for nine water-intense industry sectors, including energy, agriculture, and chemical. Geocoding allows users to plot facilities, suppliers, and potential new market locations.

Aqueduct Water Risk Atlas

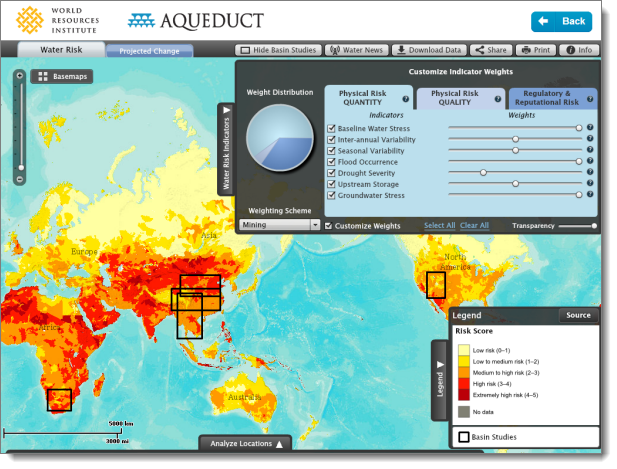
Built on ArcGIS Server 10.1, the tool takes advantage of the new “dynamic layers” capability to allow rapid rendering of more than 25,000 polygons to depict the topology of catchment areas.

Major companies around the world are already using Aqueduct to inform operations:

  • McDonalds is requiring hundreds of its suppliers to use Aqueduct to assess local water risk
  • Procter & Gamble used Aqueduct to understand how water risk may affect its global facilities
  • Bank of America Merrill Lynch used Aqueduct to illustrate water risks and opportunities for investors

“Recent history is littered with companies that failed to anticipate emerging threats. Water scarcity is one such threat,” said Andrew Steer, President of WRI. “Thankfully, forward-thinking business leaders are starting to get it. They understand that water risk is one of the top issues that they face.”

Aqueduct has received extensive media coverage, including in the New York Times, The Guardian, Fast Company, Bloomberg, and Greenbiz.

Aqueduct allows users to easily see water risk around the world. Come check out this new decision-support tool.

On the Go: USAID MEASURE DHS Data Available in New Mobile App

With pressure to base policies and programs on meticulously collected data, there is a need to make USAID funded Monitoring and Evaluation to Assess and Use Results Demographic and Health Surveys (MEASURE DHS) reports more readily available.  However, many developing countries have no access to a tangible library of DHS reports, nor a reliable internet connection to visit the MEASURE DHS website to access these surveys.

Luckily, the rapid increase in the mobile phone and smartphone usage  has given the MEASURE DHS team hope.  The popularity of these devices can grant anyone access to DHS reports, from policy makers in Washington, D.C. to remote communities in rural Africa.  In fact, according to Pingdom’s STATcounter, 15% of Africa’s internet browsing in May 2012 came from mobile devices, an increase of more than 150% from 2010.

With the help of MEASURE DHS technology partner, Blue Raster, the DHS Mobile application was developed.  MEASURE DHS mobile covers over ninety countries, including data on vaccination, childhood mortality, nutrition, HIV testing and prevalence, literacy rates, twenty other indicators.  It displays trends within a single country through Quickstats, and allows users to compare and contrast the most common indicators through a series of tables, charts and maps.  It also provides basic information about the individual surveys, such as sample size, timing, and topics included, and links to download the final reports, Key Findings, and fact sheets.

Recognizing the need to build an application that is available on multiple mobile platforms, Blue Raster, an Adobe Partner, utilized Adobe PhoneGap to compile both iOS and Android applications.  PhoneGap Build allowed Blue Raster to capitalize on their experience in web-standard technologies such as HTML5, CSS3 and Javascript to rapidly build and deploy the app.  Spatial data is delivered to the app using the ArcGIS 10.1 platform.  Basemap tiles are accessed from ArcGIS Server and ArcGIS Online, and the Esri Javascript API was used to link the geometry and data.

The app also stores all the indicator and survey data locally on the device, and periodically checks for updates.  This functionality truly enables users to connect with the data, despite the absence of consistent internet, and allows policymakers and program managers to visit field sites without having to create massive, tangible copies of data or abandon the data completely.

The DHS mobile application is free and available for Apple iOS (iPhone and iPad) and Android smartphones and tablets.  Blue Raster will work with the MEASURE DHS team to enhance the application with new features and continue to improve the user experience in the coming months.  For suggestions in improving the DHS Mobile application, please email mobile@measuredhs.com.


iTunes App Store Google Play


Page 6 of 6