Environment

World Resources Institute – Forest Atlas of the Democratic Republic of Congo

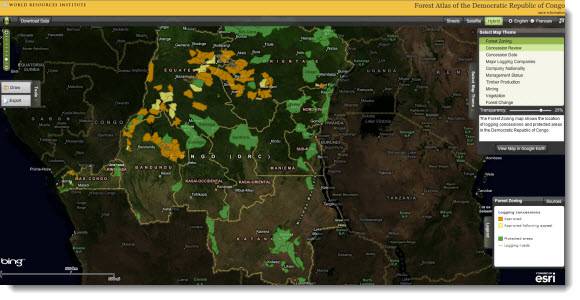
The World Resources Institute partnered with Blue Raster to create an interactive map viewer that shows development in the forests of the Democratic Republic of Congo (DRC).  Designed using ESRI ArcGIS Server 10 and the Flex API 2.2, this forest atlas allows the viewer to examine in detail logging and mining concessions, protected areas, roads, and detailed change in the forests, which cover two-thirds of the country’s territory and serve as one of the planet’s major forest carbon sinks.  The user can view the information in both English and French by themes such as forest zoning, concession date, timber production, mining, vegetation, and forest cover change.  Further, the adjustable transparency of the map layers enables the user to view the base map data underneath.

The government of DRC faces challenges in developing comprehensive forest management, zoning processes, and management of logging, mining, and agriculture.  Forest Atlas of the DRC provides easier access to current forest land allocation in the DRC and will help improve land use planning, monitoring, and resolution of conflicts over resources in areas of overlapping claims.  It will also help local NGOs and communities understand government actions and defend their access rights.

The DRC Forest Atlas map viewer is the first in a series of interactive maps focusing on forest developments and change.  Over the coming months, additional map viewers will be available for other central African countries and Indonesia.  For more information regarding the World Resources Institute Forest Atlas Project please visit http://www.wri.org/stories/2011/04/new-map-viewer-shows-development-forests-democratic-republic-congo.

Forest Atlas of the Democratic Republic of Congo

Smithsonian WILD

Candid Cameras Show Rare Glimpses of Wildlife

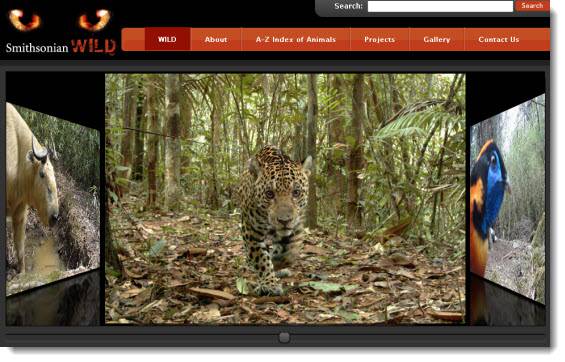
As part of a Smithsonian Web 2.0 grant, Blue Raster has developed Smithsonian Wild, an interactive web mapping application for the Smithsonian National Museum of Natural History using ESRI ArcGIS.com, ArcGIS Server Flex API, and Flickr.

Smithsonian WILD

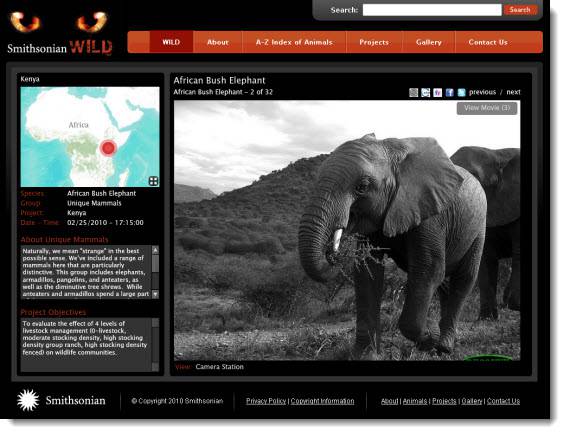
This web site offers the public a unique opportunity to observe over 250 different species in their natural habitats throughout the world.  Motion-activated ‘camera traps’ placed in various regions across the globe capture over 201,000 still images and ‘near-video’ sequences of animals as they pass.  Robert Costello, a national outreach program manager for the Smithsonian National Museum of Natural History, hopes visitors to the site “feel a sense of anticipation and excitement, like the researchers, as they explore photographs of wildlife taken in the absence of human beings and often at very short distances.”

Smithsonian WildSmithsonian Wild also offers detailed descriptions of the diverse animals and regions as well as a world map so the user is always aware where the animal being observed is located in China, Kenya, Malaysia, Panama, Peru, Thailand, or the United States.  Customized searches allow the user to choose the path of this entertaining and educational experience via species, group, or region.  Please visit Smithsonian Wild at http://siwild.si.edu/ today to view these amazing pictures and get your own rare glimpse into the animal world.  To learn more details please go to the Natural History Museum’s blog post.
Smithsonian Wild

National Geographic Fieldscope: Tools for Citizen Science

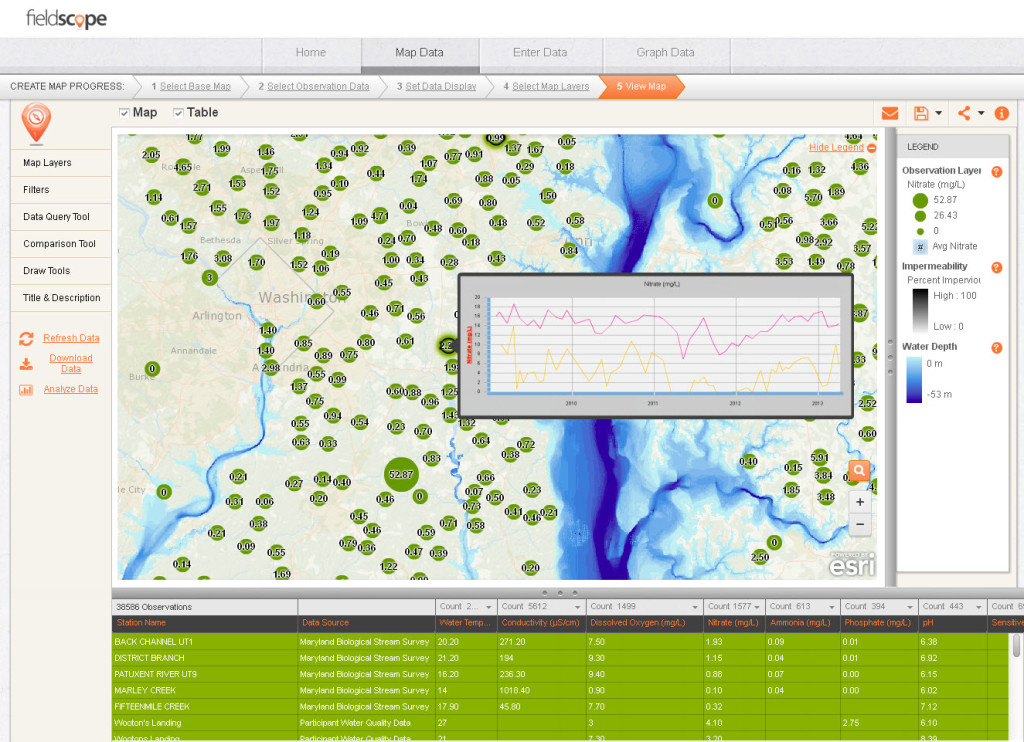
Blue Raster worked with the National Geographic Society to develop FieldScope, a mapping and analysis tool that puts data visualization and analysis into the hands of people participating in citizen science projects. The application focuses on projects with geospatial data, called “community geography” projects. Members of the public participate in data collection and analyze the data for geographic patterns.

Funded by the National Science Foundation (NSF), the application enables any organization working with citizen scientists to quickly and easily create a FieldScope project that will store their data online and analyze it using graphs and other visualizations. By combining traditional hands-on data collection with web-based mapping, users can rapidly deploy, analyze, and share their data with others. It also provides a unique educational tool that enables students and classrooms to upload field data and view it in relation to their peers and the scientific community.

Said Daniel Edelson, National Geographic’s vice president for education, “Community Geography is a ‘killer app’ for teaching young people how to reason about geography. Students get to observe firsthand how factors vary with location and to learn from the data of others about how different places are connected.”

National Geographic FieldScope - Nitrates

FieldScope was created using Adobe Flex and Flex API for ArcGIS Server. To get started with FieldScope and learn more about the project, visit the National Geographic FieldScope website.

USGS (NBII) launches AmphibiaTrends

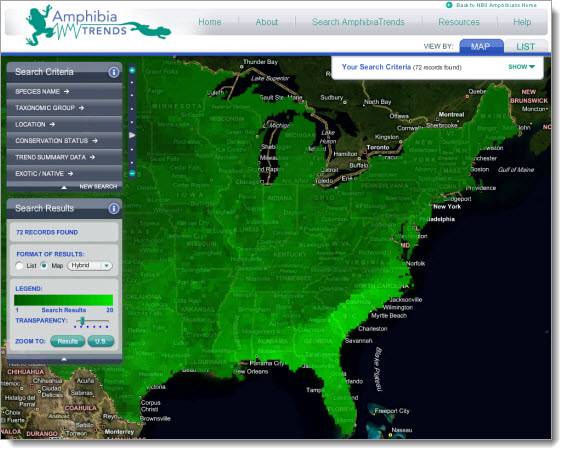
Blue Raster is pleased to announce the launch of AmphibiaTrends application for National Biological Information Infrastructure (NBII) – a part of USGS. Using ESRI ArcGIS Server and the Flex API, this application is a single source for information about the status and trends of U.S. amphibians. It provides one-stop access to information from diverse sources, including contextual information about natural history, taxonomy, and distribution, all within a single site for Amphibians in North America including frogs, salamanders, and newts.

AmphibiaTrendsLand managers and natural resource decision makers and researchers want to know about the status and trends of amphibian populations in the U.S.  Numerous amphibian monitoring programs collect this information at the national, regional and local levels.  AmphibiaTrends brings them together into one site, to give you easy access to current trends and status of our nation’s amphibians. Search by species, location, conservation status, or taxonomic order to view reports including distribution maps, detailed species and habitat descriptions and the latest trend information from the experts. Visit AmphibiaTrends today.


Smithsonian – North American Mammals

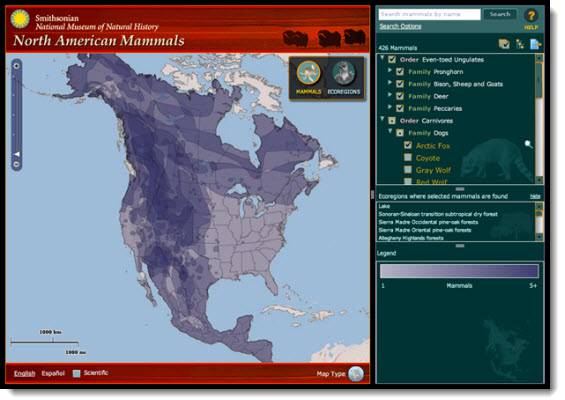
Smithsonian National Museum of Natural History has asked Blue Raster to recreate its interactive searching tool for North American Mammals.  Migrating from the legacy ArcIMS application to ESRI ArcGIS Server and Flex API with a custom-based map, this web site has been designed to serve as a comprehensive resource for students, teachers, and the general public and will make accessible the Museum’s unparalleled natural history collections, scientific research, permanent and special exhibits, and libraries.  With detailed descriptions, images, and distribution ranges for more than 400 mammals native to the North American continent, this new application allows users to examine the distribution of mammals over the continent through complex and customized searches of animals, locations, and conservation statuses.  The map provides a variety of filters to refine a user’s search, including topography. Users can also create a Field Guide from their search to take into the outdoors. For more information regarding the Smithsonian National Museum of Natural History launch-please visit North American Mammals.
Smithsonian North American Mammals


Page 22 of 24