Story Map

DCPS Recycles Right

Have you ever wondered where plastic comes from, how plastic bottles are made, or where it goes when recycled? The students of Washington, DC public schools are learning the answers.

To celebrate America Recycles Day (November 15th), the Department of General Services (DGS) in Washington, D.C. is launching a brand new series of Story Maps focusing on some of the most commonly found items in a school cafeteria. The Story of Waste looks at how everyday items are produced, transported, consumed and recycled. The stories help teach students the global supply chain of products, where waste from their cafeteria goes, and what it becomes.

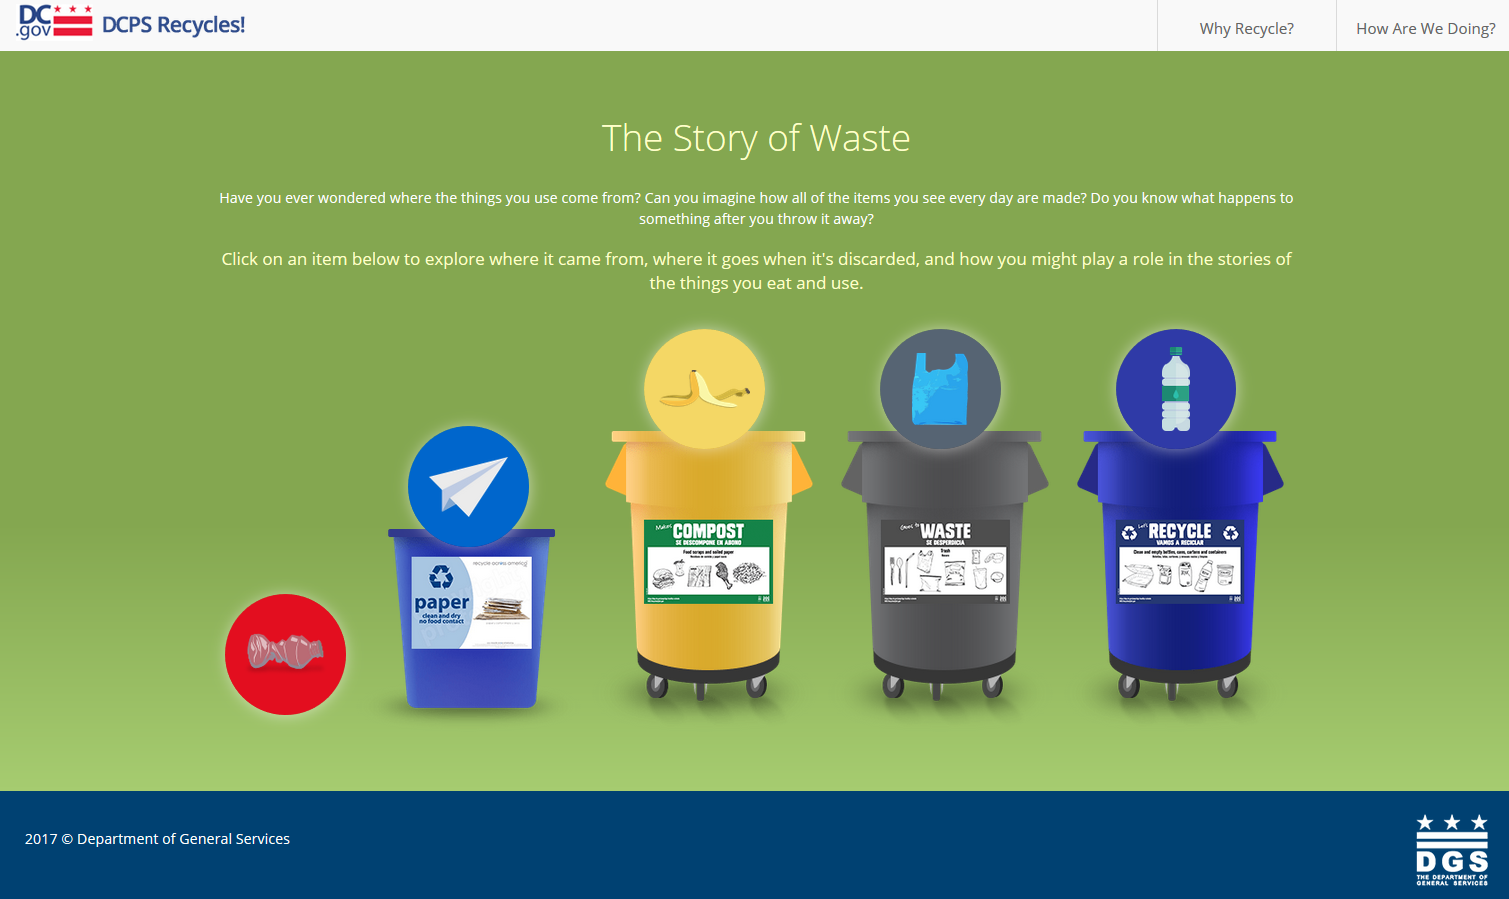
Did you know that over 8 million metric tons of plastic enter our oceans each year? The stories also share statistics on waste to help students understand the importance and impact of recycling right. Narratives showing the recycle, waste and compost paths of a banana peel, plastic bag, and plastic bottle are complete. DGS and Blue Raster are working on additional stories for paper and incorrectly disposed plastic bottles, coming soon.

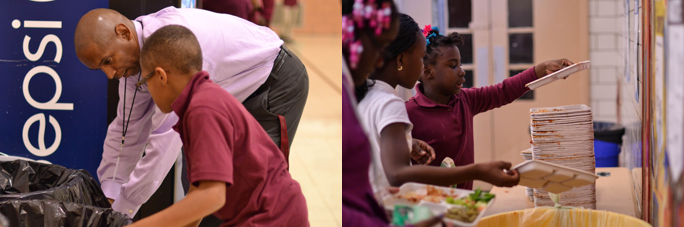
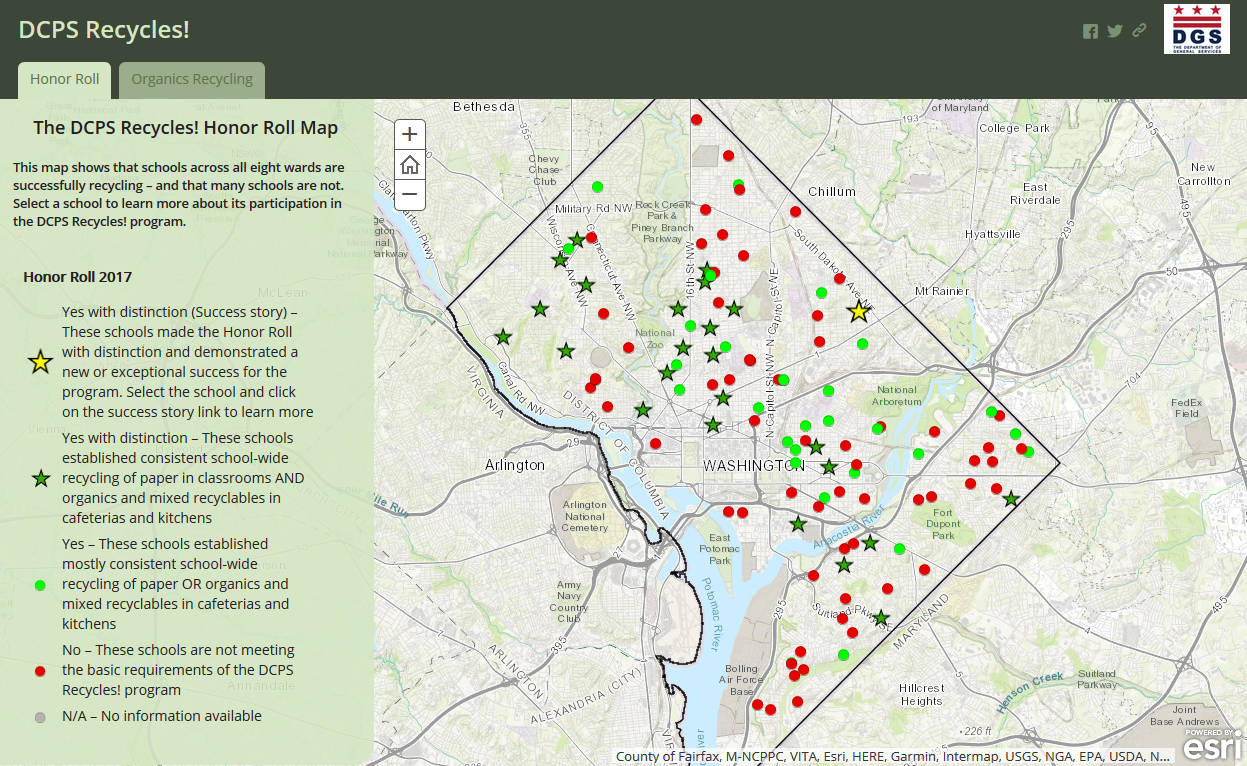
DGS is working with over 100 public schools on programs for recycling and composting. In 2010 the city enacted the DC Healthy Schools Act which aims to improve health and wellness of students. Each year, schools are recognized for meeting the requirements of the program and an application was built to highlight Honor Roll schools on a map.

Check out these great stories today!
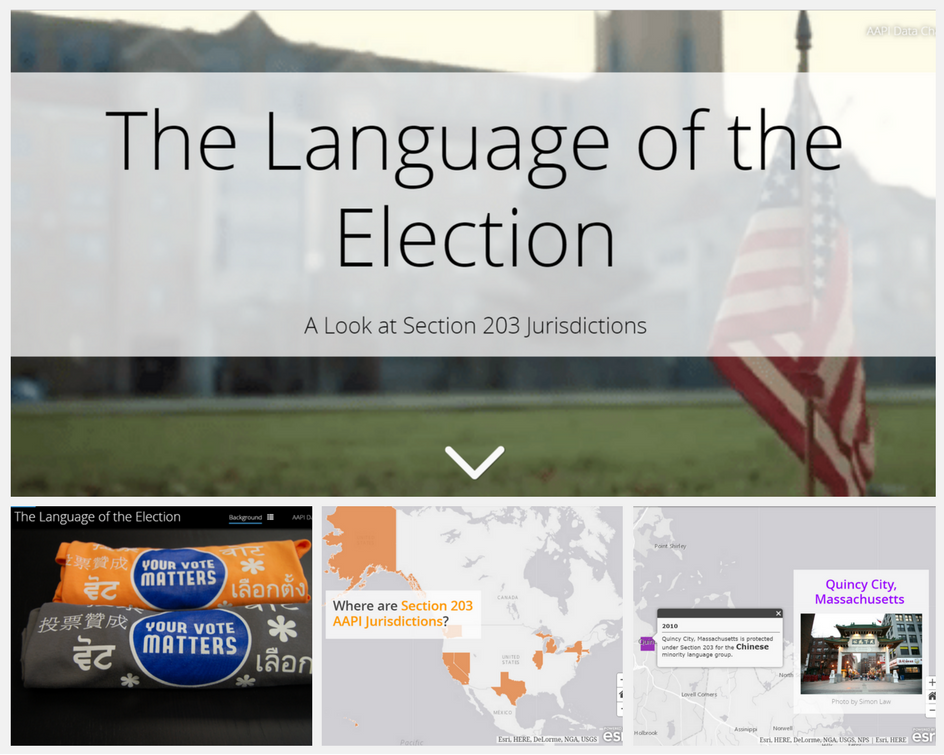
Highlights from the 2017 Esri UC

The Blue Raster team is very excited to share the details of our experience at the 2017 Esri UC and Education Conference in San Diego!


group photo

Highlights:

We had lots of fun using the Story Map Cascade template to document our trip. Check out our Esri 2017 UC Story Map for a closer look at our adventures.

Penn State GIS Day

Penn State Graduates Stephen Ansari (Earth Science, 1998) and Chris Gabris (Geography, 2009) are proud to share a Blue Raster Story about GIS helping reduce illegal fires in Indonesia and aiding the world’s commitment to sustainable and responsible supply chains for consumer goods.

This video will weave together the perils of illegal fires, the growing demand for palm oil and global deforestation with a GIS success story about using remote sensing, high-resolution imagery, satellites that can detect fires, text-message alert systems and presidential decision rooms.

The world is watching and change is happening.

psu-gis-day-2016

View the Penn State GIS Day presentation at: ArcG.IS/2fksZxK

Information on Penn State’s GIS Day can be found at: sites.psu.edu/gisday

See GFW Fires in action at: fires.globalforestwatch.org/

Enjoy this Background Video about the project:

TNC Story Map: Planting Healthy Air

By 2050, the majority of humanity will live in cities, towns, and other urban areas. Among the most pressing of global urban environmental challenges is air quality. In cities, the most damaging air pollutant is particulate matter (PM), but another pressing problem cities face is heat: the air is simply so hot in summer that human health is impacted. At the same time, with climate change, increasing temperatures around the world are exacerbating excess heat produced by cities and causing dangerous heat waves.

To address this concern for the future, The Nature Conservancy (TNC) investigated the effect of planting trees in urban areas. The science is clear that tree leaves play a part in removing particulate matter from the atmosphere along with many other air pollutants. Also, the shade provided by urban trees along with the transpiration of water during photosynthesis can help reduce air temperatures, while also reducing electricity needed for residential cooling. From an economic perspective, TNC found planting trees produces a significant return on investment when planted strategically in certain areas of a city.

17_trees_remove_pollution_1To determine precisely where and how much trees can help, The Nature Conservancy collected geospatial information on forest and land cover, PM2.5 pollutant concentration, and population density for 245 cities and used relationships established in the literature to estimate the scope of current and future street trees needed to make urban air healthier. The resultant report, titled “Planting Healthy Air,” advises cities on where trees offer the highest return on investment for improving public health by addressing particulate matter and excess heat.

To help visualize this data and share this story, TNC came to Blue Raster for help creating an interactive story map built on the latest Esri technology. The Planting Healthy Air story map details the project’s motivation, visualizes its geographic data and geospatial analysis, and describes a simple plan for cities to reduce pollution and temperature by planting trees. The viewer can select a section of interest or scroll through all of them, exploring and interacting with maps. Viewers can see neighborhood-level analysis in any of the 245 cities included in the report or read in-depth remarks about one of 15 focus cities.

tncstorymap_benefitsoftrees

Built on ArcGIS Online, the Planting Healthy Air story map uses Cascade, a new template designed for immersive storytelling. The story map’s interactive format allows viewers to explore the data and analysis on their own terms and get personalized information about the places that matter to them.

“Thanks to Blue Raster for all their hard work. We’re really excited about this new resource for sharing our science!”

– Misty Edgecomb, Director of Communications, Global Cities, The Nature Conservancy

Read more on this exciting project at: https://global.nature.org/content/healthyair

Blue Raster at the White House AAPI Data Challenge


Elevate: AAPI Data Challenge
Blue Raster is excited to attend and present at the 2016 White House Asian Americans and Pacific Islander (AAPI) Data Challenge & Convening on October 7th. The event highlights the importance of AAPI data and how it can be used to improve outcomes in areas including education, health, and civic participation.

Christina Phang will tell the story — Language of the Election — how a little known provision of the Voting Rights Act brings bilingual voting materials and ballots to minority-language citizens. The talk will highlight how we used a story map and geographic visualizations to bring a temporarily relevant topic to life. This presentation is part of a collaboration between Blue Raster and Esri. For more information about the event, visit the White House’s Elevate: AAPI Data Challenge event site.
 

cphang2Every vote matters, and language should not be a barrier to participation. Our ArcGIS Online Story Map shares how a little known provision of the Voting Rights Act invites participation and enfranchises minority-language speaking communities, and you may be surprised which community is growing the fastest.
Christina Phang, Blue Raster

See how an ArcGIS Story Map delivers a platform for sharing ideas and telling stories that matter:

aapi-storymap


Page 5 of 9