ArcGIS for Server

A New Chapter on Tsunami Design

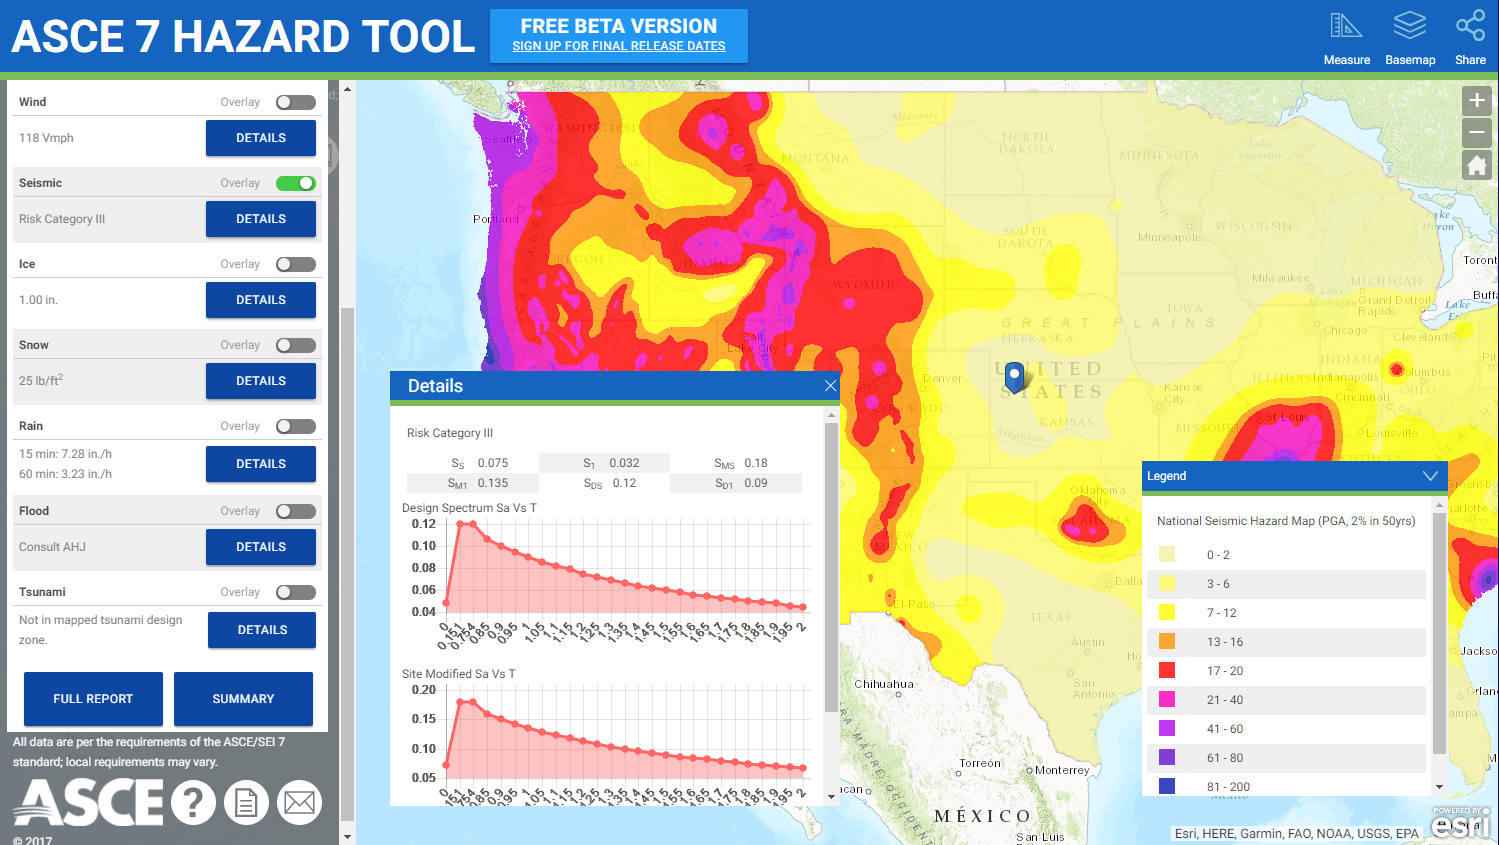
New design provisions for tsunami loads and effects have been developed by the ASCE 7 Tsunami Loads and Effects Subcommittee (TLESC), and are included in the just-released 2016 edition of the internationally recognized loading standard ASCE 7, Minimum Design Loads and Associated Criteria for Buildings and Other Structures (ASCE/SEI 7-16). This resource and accompanying data was developed over a 34-month period by a subcommittee of almost 30 members, along with the contributions and review of numerous other state, national, and international stakeholders. To provide the authoritative distribution of this tsunami design information, Blue Raster and the Structural Engineering Institute of ASCE have created the ASCE Tsunami Design Geodatabase application.

Offshore Tsunami Amplitude Analysis

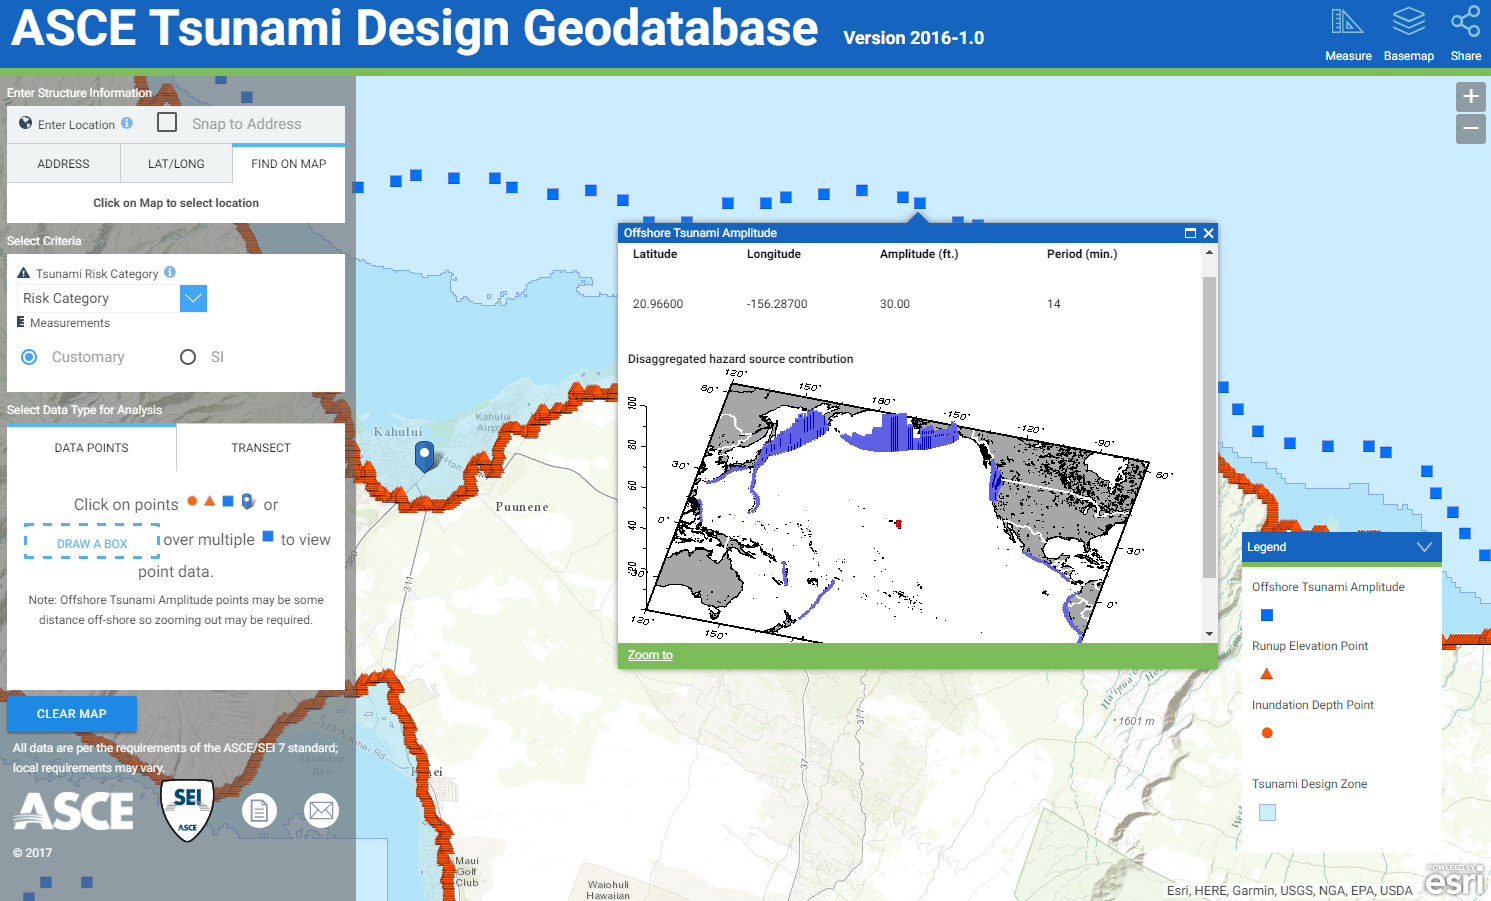
The ASCE Tsunami Design Geodatabase application provides insight into the first national, consensus-based standard for tsunami resilience for use in the states of Alaska, Washington, Oregon, California, and Hawaii. Structural engineers are already being asked to incorporate tsunami-resilient designs in various critical building and facility structures in the five western states, The profession and the affected communities now have a comprehensive consensus on loading and design standards for buildings and other structures.

Transect of Elevation

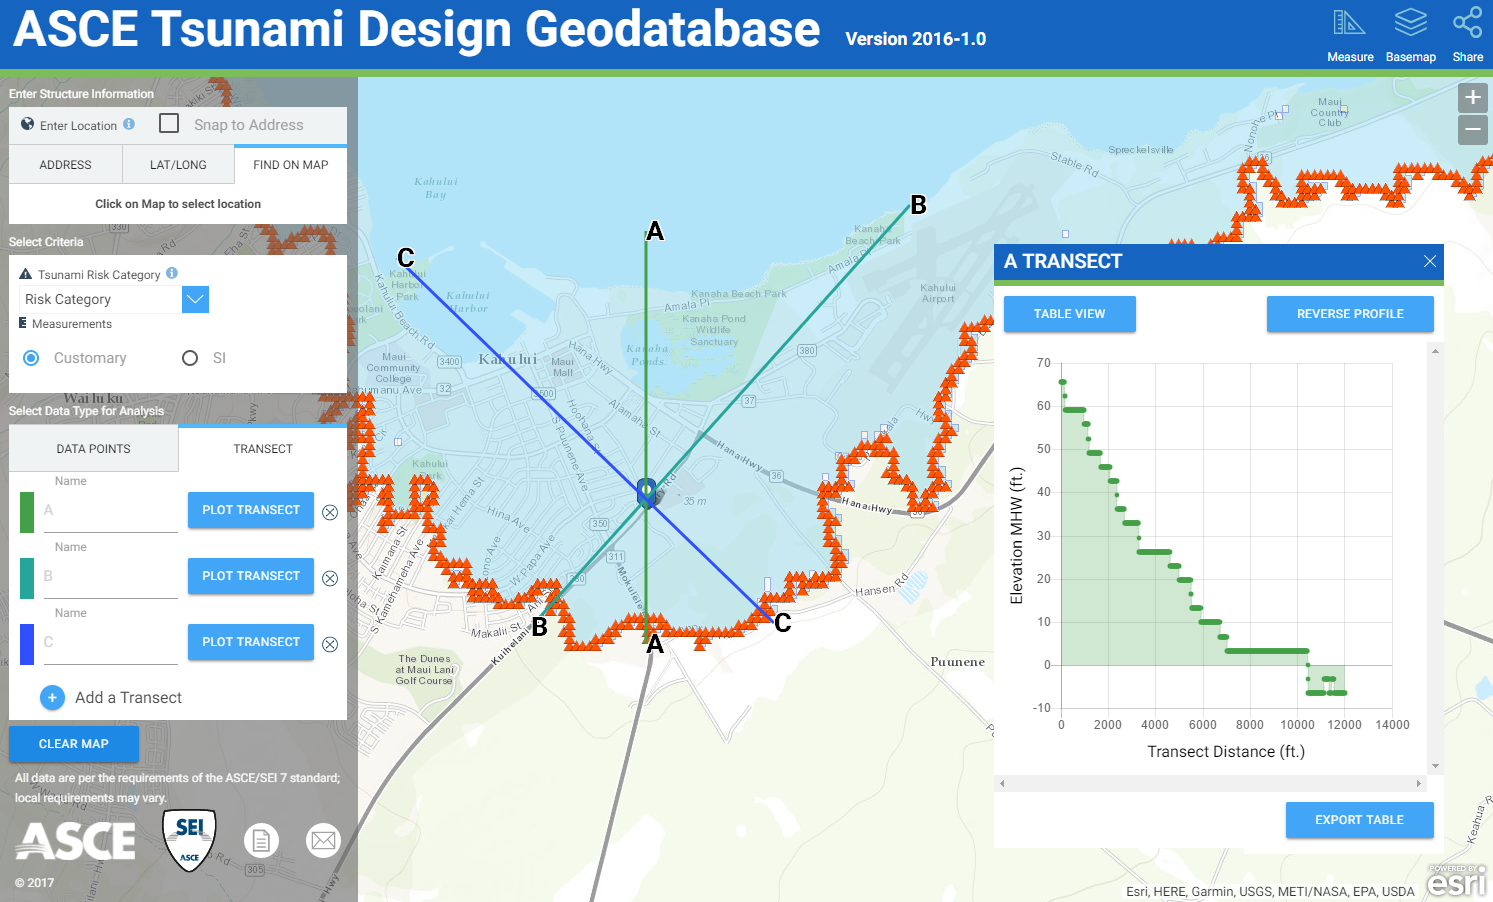
The new tsunami design zone maps define the coastal zones where structures of specified risk would be designed for tsunami resistance. Easy access to this data through the ASCE Tsunami Design Geodatabase application is imperative for the resiliency of our coastal infrastructure.

Keeping America’s Infrastructure Safe with ASCE

Blue Raster and the American Society of Civil Engineers (ASCE) are pleased to announce the launch of the ASCE 7 Hazard Tool, to accompany the just-released 2016 edition of the internationally recognized loading standard ASCE 7, Minimum Design Loads and Associated Criteria for Buildings and Other Structures (ASCE/SEI 7-16). This tool is designed to provide users with environmental loading limit information for infrastructure based on location and risk category. For example, how much ice thickness must a school be able to safely carry in Minnesota? To what level of tsunami inundation will a hospital need to be elevated in California? To find out, the new ASCE 7 Hazard Tool provides a single destination for quickly retrieving your choice of hazard data, including:

  • basic wind speed
  • seismic accelerations
  • flood zone and base flood elevation
  • ground snow load
  • rain load
  • tsunami-load risk
  • ice thickness

A full downloadable PDF report of all variables selected is also available for incorporation into site studies or building construction documents.

The fully functional site will be available to paid subscribers only (following the initial Beta period), however, wind and tsunami data will be available to all to show site functionality and utility. Make the ASCE 7 Hazard Tool the first stop for new infrastructure construction in America, and help keep us safe from environmental hazards.

Global Fires Analyzed by Country

Produced in partnership with the World Resources Institute, the recently updated Global Forest Watch Fires (GFW Fires) is an online platform for monitoring and responding to forest and land fires using near-real-time information. GFW Fires empowers people to better respond to harmful fires before they burn out of control, holding accountable those who may have burned forests illegally.

With the most recent release of GFW Fires, users can explore fire events for every country around the world over the last five years — using two sensor products: VIIRS and MODIS. Fire history, cumulative fires to date, and a statistical analysis by administrative boundaries allow great insight into fire events within a country or around the world.

Fire Report for Tanzania

Be sure to check out your country of interest at GFW Fires, and see how technology is harnessed to address a major global concern.


Keeping Trees Green with DDOT

Blue Raster and the District Department of Transportation (DDOT) worked together to create and launch a mobile-friendly DC Tree Watering Application. Keeping trees green in our city is a full time job for contractors, but their efforts can be significantly augmented by community involvement and the public’s willingness to water trees during the hot, dry summer months. The first two years of a planted tree’s life are critical, and every watering event increases the survival rate of the trees.

The application is powered by spatial data services hosted by the Office of the Chief Technology Officer (OCTO) ArcGIS Server, and a webmap in ArcGIS Online that can be easily updated or customized by DDOT in the future. A story map is also included that gives further information about each of the tree types in DC. Watering events or reports that trees need help are recorded by the application and used by DDOT to determine which trees may need additional attention. The option to upload a photo of people caring for their trees will let the community show DDOT how much they appreciate their urban canopy as well as people’s willingness to help keep our trees happy and healthy for generations to come.

Photo of Mayor Muriel BowserMayor Muriel Bowser launched the new DC Tree Watering Application during her recent Ward 6 community walk. “We are committed to embracing smart technology across city government, and with the launch of the new DC Tree Watering App we are encouraging all District residents to help support our urban forestry,” said Mayor Bowser. “Watering is the easiest and most affordable way for residents to help, and this app will allow us to coordinate our efforts.” 

Check out the DC Tree Watering Application, find your house, and see if there’s a tree in need outside that could use your help!


Discover Cambodia’s Watersheds and Ecosystems with WESTool

Blue Raster is proud to announce a partnership with Winrock International that has resulted in a completely redesigned Watershed Ecosystem Services Tool (WESTool), allowing users to explore the interaction of ecosystem services, land uses and socioeconomic factors across Cambodia’s landscapes. By combining advanced science with intuitive maps and tools, the WESTool offers valuable information at the local, regional and national scale to support decision makers and land managers who wish to understand and balance the value of remaining forests with development goals.

The WESTool estimates land use change, carbon stocks, greenhouse gas emissions, sediment and nutrient loss, changes in river water quality, impacts on biodiversity, population, access to market, and general agricultural production data at the national and local levels in Cambodia. This provides a valuable resource for anyone interested in learning more about the the impacts of land use change on forest ecosystem services, people and the economy in Cambodia. The tool provides for a more comprehensive understanding of the implications of land management decisions by offering information on both the historical impacts of land use change and the current value of ecosystem services.

As part of this project, Blue Raster redesigned an existing application using modern JavaScript and HTML frameworks, integrated openpyxl to create a custom summary analysis excel file based on user-specified areas, and optimized existing web services using Esri’s ArcGIS for Server to achieve a fast and responsive web experience.

“As the lead developer of the WESTool for Winrock I’m incredibly grateful to have partnered with Blue Raster on the development of the WESTool.  It is rare to have a team of developers that both have the technical chops to get the job done and the creative vison to take your idea and make them a reality.  Thanks BR!”

– Michael Netzer, Program Officer, Winrock  

Be sure to check out the interactive mapping application today!


Page 4 of 6