Our Work

Blue Raster helps you tell your story through interactive
mapping technology. Make your message clear, exciting,
and user-friendly for both mobile and web platforms.

ArcGIS for Server

Esri ArcGIS Cloud Specialty: Elevating our clients’ GIS capabilities to the sky

Blue Raster is thrilled to be a member of the Esri ArcGIS Cloud Services Specialty. This specialty designates Blue Raster as an expert in deploying and managing ArcGIS in cloud environments such as Amazon Web Services (AWS) and Microsoft Azure. The Cloud Specialty program is designed to help Esri connect customers with recognized Partners that can best provide ArcGIS cloud solutions. Partners that meet the criteria for this specialty must demonstrate a track record of delivering value to their customers in implementing, managing, and designing cloud infrastructure in the Esri ArcGIS environment.  

Esri Cloud Services Specialty

To attain this specialty, Esri assessed Blue Raster’s expertise in the following areas of ArcGIS Cloud services: cloud deployments, system architecture and design, migrations, and managed services. Our deployments of ArcGIS Enterprise in the cloud include routine monitoring and maintenance to allow us to fine tune the system as needed, ensuring reliability and performance. Our system architecture and design experience encompasses single machine and multi machine architectures in both AWS and Azure that are customized to our clients’ specifications. We support all types of migrations including on-premises to cloud provider migrations, ArcGIS Online to ArcGIS Enterprise, and integration with third party providers.

Our portfolio of managed services includes the utilization of a wealth of Esri products and tools in the ArcGIS family such as ArcGIS Enterprise, Data Store, GIS Server, GeoAnalytics Server, GeoEvent Server, Notebooks, Image Server, Pro, Monitor, and Enterprise Geodatabases. Implementing these tools empowers us to provide a number of managed cloud services to our clients including design consultation, server construction, Esri software installation, infrastructure troubleshooting, distributed systems configuration, geographic redundancy configuration, OS patching, Esri security patching, routine Esri patch deployment, DevOps services, and user training services, among others. Blue Raster is primed and ready to meet our clients’ needs in all areas of the Esri ArcGIS cloud.

ArcGIS Cloud Solutions by Blue Raster

With over 10 years of experience providing ArcGIS Cloud consulting services, Blue Raster is proud to be a trusted resource for a variety of cloud solutions, including: 

    • Cloud ArcGIS Enterprise implementation 
    • Data migration 
    • System architecture and design 
    • Enterprise migration 
    • Security 

We use our cloud expertise to assist a variety of clients with a range of projects. Our dedicated DevOps team supports our cloud projects from requirements gathering through completion. Keep checking our blog posts for our latest projects as we continually grow and evolve our cloud-based service offerings.  

Are you looking to expand your ArcGIS capabilities in the cloud?
Contact us today to learn more about how we can help!

Improving Deforestation Risk Management in Commodity Supply Chain

Blue Raster developed Global Forest Watch Pro, a decision support tool that empowers companies to monitor their supply chains for responsible environmental practices. Companies can upload all of their of sourcing areas, farms, and supply sheds for analysis and view interactive maps and diagnostics displaying occurrences of deforestation, alerts for forest fires, land cover types. The site now serves nearly 1,000 users across approximately 350 organizational accounts. Current users are spread across every continent in the world.

GFW Pro map

To support the growing use, Blue Raster recently implemented several updates. The analysis back-end is modernized to make it more scalable and provides more power for processing data faster. The team also moved to a Spark engine and incorporated an AWS Step workflow to allow for higher data processing capacity and improved functionality for the tool.

Mekong Monitor – Providing Vital Insight for River-dependent Communities

The Mekong River runs through six countries: China, Myanmar, Laos, Thailand, and Cambodia, and Vietnam. It provides a livelihood and natural resources for over 60 million people. New upstream dams in China are changing the waterflow, creating a huge impact on the countries and people that depend on the river. Using the Mekong Dam Monitor as a tool, the Stimson Center’s Southeast Asia Program and Eyes on Earth, Inc committed to working with countries to gain more visibility into the flow of the river and better plan for water availability.

Mekong Monitor
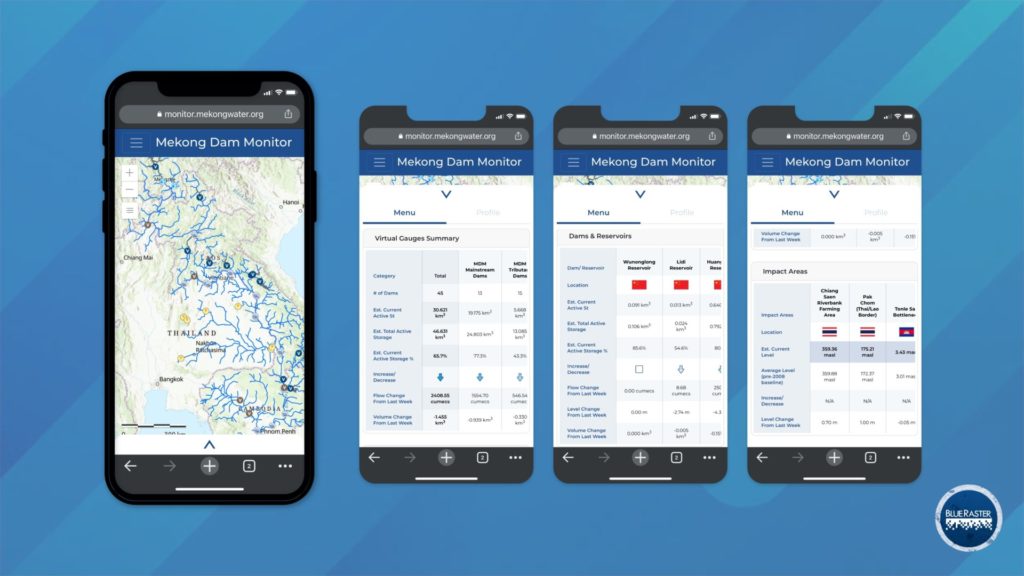
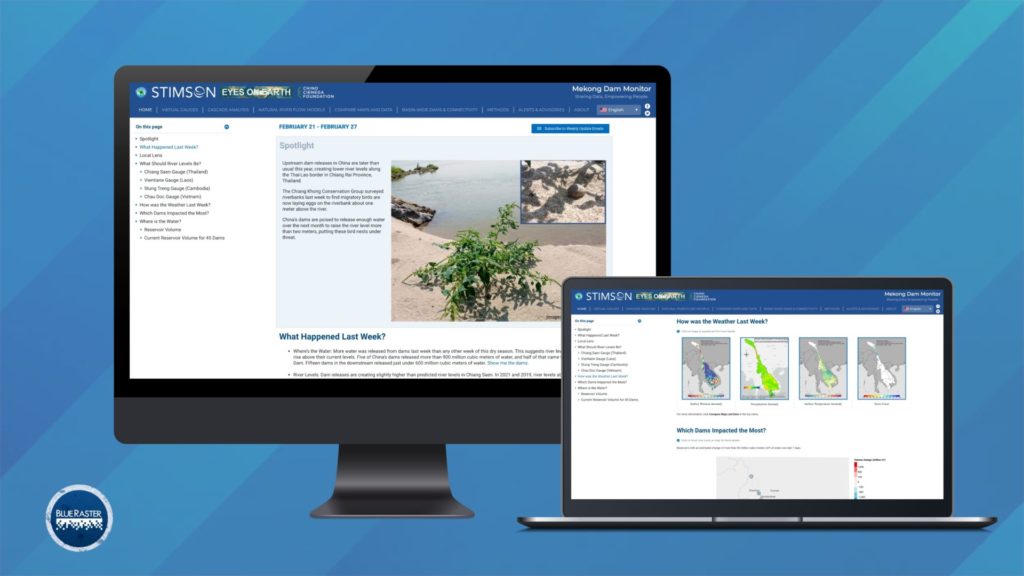
Blue Raster developed the
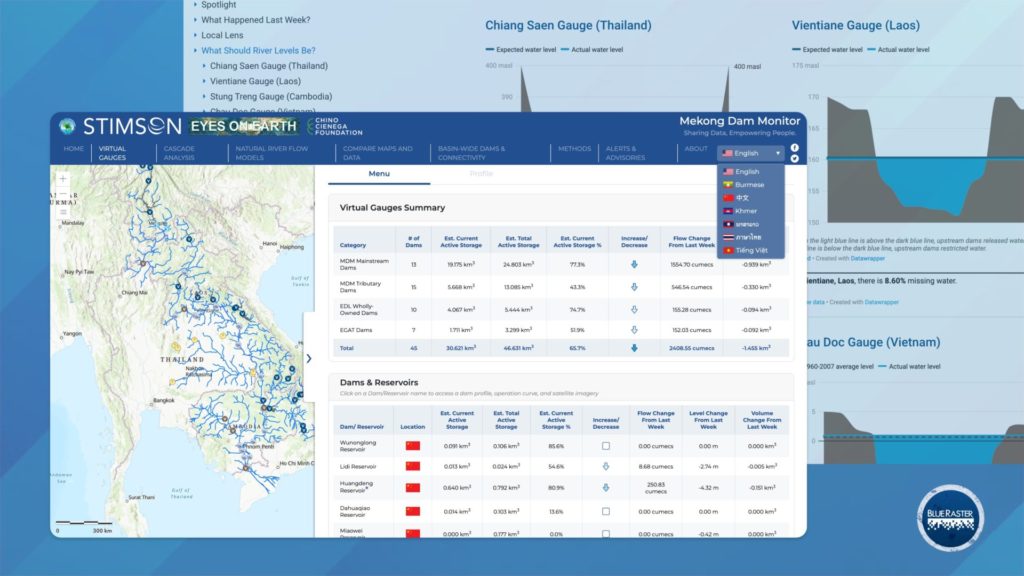
 Mekong Dam Monitor to provide unprecedented transparency of the flow of water and conditions of dams and reservoirs along the Mekong River. Using satellite data as well as weather and water gauge data, the monitor provides visibility into what is happening upstream, giving a comprehensive near-real time view of the current state of the Mekong basin along with historic conditions. This allows people all along the river and those advocating for more equitable and sustainable use of the river to understand and plan for changes in the levels of the river.

Mekong Monitor

In late 2021, Blue Raster integrated WordPress into the application, making it easier for the project administrators to make updates to the site themselves. The site also received an update to the UI, making it more mobile friendly to support growing field use. Finally, the team also coordinated making the site available in six local languages, increasing the access to this valuable data on water levels and projected water flow.

Mekong Monitor

Blue Raster is proud to continue to support this project, providing real time visibility and reporting on impacts of up river decisions on the various communities that rely on the Mekong.

Clearview Analytics Tool: Accelerating Economic Insight

Avenu Insights, a company focused on improving and maintaining revenue streams for state and local governments, and Blue Raster have just released the first iteration of the Clearview Analytics Economic Development Insights (EDI) tool. The Economic Development tool provides key insights to cities and counties to attract new business, plan future investments, and understand the competitive landscape. The tool is completely interactive and allows users to enter, analyze, and export data for their unique area of interest.

Input an address or select a point on the map to create reports using drive time distances that visualized areas of economic influence and reach

Economic Insights

The new tool uses Avenu Insight's Property Tax and Commercial Sales Tax in combination with ArcGIS GeoEnrichment and Analysis capabilities for site-level analysis of tax revenue. Some of the features of this tool include:

  • Integration with key Demographic and Economic indicators from the ArcGIS GeoEnrichment API to assess market suitability
  • Drive-Time Analysis capabilities from ArcGIS Online to set market areas of interest
  • Up-to-date Property and Sales Tax Revenue data on a quarterly reporting basis, broken down by NAICS code at the individual property level

Providing cities and counties this analysis tool is critical in supporting the economic growth and future success within that landscape. With this tool, businesses and Governments can answer a variety of questions they might have:

"What is the current composition a specific area by business sector?" or "How much growth has retain seen in the central business district in the past few years?"


Econimic Insight tool

For a limited time, Avenu is offering a Free Trial of the Clearview EDI tool for your jurisdiction. Don't miss this opportunity to be a pioneer for this tool and provide feedback for future iterations.

Blue Raster worked closely with Avenu Insights to build out this tool through design, development, deployment using the latest Esri Enterprise 10.7.1, the ArcGIS API for JavaScript, and Esri's Geoenrichment API. In addition, our team worked with Avenu Insights to configure and maintain their ArcGIS Enterprise Server. Our team is excited to continue GIS analysis and capabilities which support healthy economies.

Want to learn more about GIS for Economic Insight?

Contact us today!

Global Forest Watch Fires: New Fire Monitoring Capabilities

Thousands of fires are burning in the Amazon rainforest in Brazil - the most intense blazes for almost a decade. Global Forest Watch Fires (GFW Fires), an online platform for monitoring and responding to forest and land fires, provides a near real-time view into the current fire activity. Additionally, users can view fire reports and compare historical data on regions all over the world.

GFW Fires Report

New Updates to GFW Fires

Blue Raster recently worked to add new features and capabilties to the Global Forest Watch Fires application. Want to see details for a specific area on the map? Draw or upload a shapefile to calculate fire counts and subscribe to alerts. Users can select specific areas and see the calculated numbers of VIIRS and MODIS Alerts in the past 24 hours. Next, users can click on the drawn or uploaded shapes on the map to subscribe to alerts for that area.

Global Forest Watch Fire Reports provide robust insight into fire history, cumulative fires to date, and a statistical analysis by administrative boundaries within a country or around the world. New to GFW Fires, users can now view charts of unusual fire activity. The report compares fires from the current week to the same week in the previous 16 years. In addition, new charts analyze fire activity in Palm Oil Concessions and Wood Fiber Areas.

Global Forest Watch Fires Report
Fire alerts in the Amazonas region of Brazil.

In addition to the basemap imagery, Global Forest Watch Fires now provides an option for Sentinal Imagery. The latest satellite imagery is available from Sentinel-2 and Landsat 8. Sentinel-2, operated by the European Space Agency, has global coverage in 10-meter resolution, and can obtain updated imagery every 10 days.

Global Forest Watch Fires Sentinal Imagery

By using the latest geospatial technology, Global Forest Watch Fires allows anyone to access near real-time information about where and how forests are changing around the world. Users can monitor fire activity, sign up to receive alerts, or share their own stories on GFW's blog. Explore this interactive map today.


Page 1 of 6