Environment

London Zoo and Sustainable Palm Oil

The Zoological Society of London (ZSL) has devoted its efforts to wildlife conservation in Britain and around the world for over 180 years. At the upcoming Roundtable on Sustainable Palm Oil (RT14), ZSL will present a new release of their Sustainable Palm Oil Transparency Toolkit (SPOTT), a project they began two years ago with help from Blue Raster.

The toolkit provides a set of practical tools and information that help stakeholders in the palm oil supply chain monitor and manage the environmental and social risks of palm oil production. An interactive map, created by Blue Raster, allows users to overlay palm oil concessions with relevant environmental data. The upgraded version of this map features new data sets, including:

  • RSPO certified and FoodReg palm oil mills (WRI)concessions_mobile
  • GLAD tree cover loss
  • Intact forest landscapes
  • Peat lands
  • BirdLife Endemic Areas
  • Orangutan habitat
  • Tiger habitat

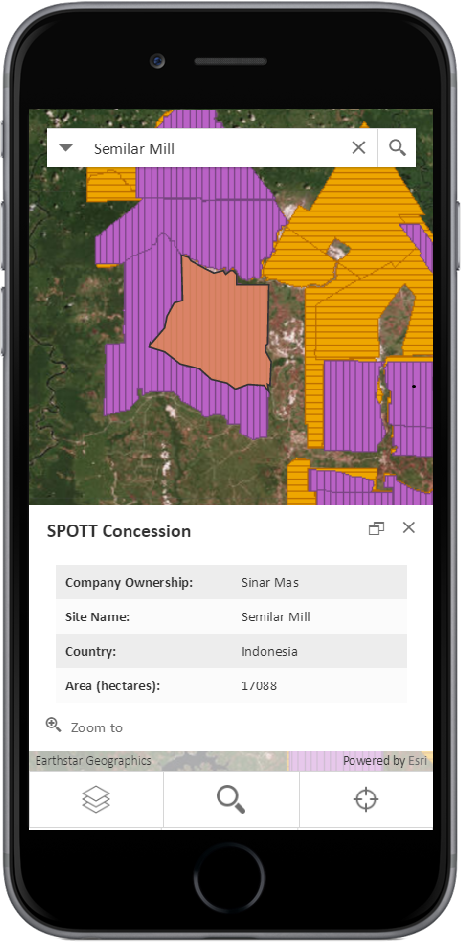
The map is capable of location search by address, coordinates or decimal degrees and layer search by concession type. It has a responsive design for use on mobile and tablet devices and has been updated with the latest Esri JavaScript, version 4.1. Check out the application here to explore the palm oil industry and learn more about its environmental impacts.

We have worked closely with Blue Raster since 2014 to develop the SPOTT map, bringing together the most relevant data from Global Forest Watch and other platforms, and linking them directly to our corporate transparency assessments… Next year, we are expanding SPOTT to assess companies with operations in other commodities, starting with timber, pulp and paper, so the next phase of development will see even more data and functionality added to the SPOTT map from GFW and elsewhere.

Alexis Hatto, Engagement Manager for ZSL’s Business and Biodiversity Programme


TNC Story Map: Planting Healthy Air

By 2050, the majority of humanity will live in cities, towns, and other urban areas. Among the most pressing of global urban environmental challenges is air quality. In cities, the most damaging air pollutant is particulate matter (PM), but another pressing problem cities face is heat: the air is simply so hot in summer that human health is impacted. At the same time, with climate change, increasing temperatures around the world are exacerbating excess heat produced by cities and causing dangerous heat waves.

To address this concern for the future, The Nature Conservancy (TNC) investigated the effect of planting trees in urban areas. The science is clear that tree leaves play a part in removing particulate matter from the atmosphere along with many other air pollutants. Also, the shade provided by urban trees along with the transpiration of water during photosynthesis can help reduce air temperatures, while also reducing electricity needed for residential cooling. From an economic perspective, TNC found planting trees produces a significant return on investment when planted strategically in certain areas of a city.

17_trees_remove_pollution_1To determine precisely where and how much trees can help, The Nature Conservancy collected geospatial information on forest and land cover, PM2.5 pollutant concentration, and population density for 245 cities and used relationships established in the literature to estimate the scope of current and future street trees needed to make urban air healthier. The resultant report, titled “Planting Healthy Air,” advises cities on where trees offer the highest return on investment for improving public health by addressing particulate matter and excess heat.

To help visualize this data and share this story, TNC came to Blue Raster for help creating an interactive story map built on the latest Esri technology. The Planting Healthy Air story map details the project’s motivation, visualizes its geographic data and geospatial analysis, and describes a simple plan for cities to reduce pollution and temperature by planting trees. The viewer can select a section of interest or scroll through all of them, exploring and interacting with maps. Viewers can see neighborhood-level analysis in any of the 245 cities included in the report or read in-depth remarks about one of 15 focus cities.

tncstorymap_benefitsoftrees

Built on ArcGIS Online, the Planting Healthy Air story map uses Cascade, a new template designed for immersive storytelling. The story map’s interactive format allows viewers to explore the data and analysis on their own terms and get personalized information about the places that matter to them.

“Thanks to Blue Raster for all their hard work. We’re really excited about this new resource for sharing our science!”

– Misty Edgecomb, Director of Communications, Global Cities, The Nature Conservancy

Read more on this exciting project at: https://global.nature.org/content/healthyair

Clear the Air for Children: UNICEF

Blue Raster collaborated with The United Nations Children’s Fund (UNICEF) to help produce Clear the Air for Children: The impact of air pollution on children. In the first analysis of its kind, Blue Raster and UNICEF used satellite imagery of outdoor air pollution in combination with global demographic data to determine that 300 million children currently live in areas with toxic levels of pollution, and 2 billion live in areas where pollution levels exceed international standards. The report also highlights that many of the poorest children were especially at risk because they have little or no access to resources for treatment and protection.

Air pollution is a critical health issue to people all over the world. Children are especially vulnerable to air pollution due to their physiology: their lungs are still developing, and exposure to harmful air during this critical period can be especially detrimental, causing life-threatening diseases. A growing number of studies are even pointing to the impacts of air pollution on a cognitive development.

UNICEF has made its mission protecting and empowering children around the world. With Blue Raster’s help, UNICEF identifies the children who are most vulnerable to the dangers of air pollution and promotes a greater understanding of this issue among governments, communities, and families. Further geospatial analysis through ArcGIS Desktop and ArcGIS Online can help us pinpoint sources of pollution and create plans for reducing pollution in the future.

“With thanks to Blue Raster, we were able to do in-depth analysis to determine how many children live in areas with high levels of air pollution. Blue Raster brought professionalism and very strong technical expertise to the project, helping us to do groundbreaking work that we hope will serve as a strong base for action on air pollution – this is not just a major threat to the environment, it is also a major threat to children’s health.”

Nicholas Rees, Policy Analysis Specialist, UNICEF New York

GFW Map Builder

Environmental restoration is becoming a top priority for many countries around the world, but it can be difficult to synthesize the numerous sources of information available to make decisions about where this restoration should happen. With the new GFW Map Builder template, anyone can create an online map application visualizing and analyzing their data alongside local, regional, or global land use data to identify future restoration priorities.

Blue Raster created Map Builder, a configurable ArcGIS Online template, for the World Resource Institute’s Global Forest Watch (GFW) program. The template allows users to overlay their own datasets, such as endangered species habitats, commercial concessions, or national protected areas, with GFW land cover and land cover change data in order to pinpoint the best locations to focus restoration efforts. The template provides built-in metadata and analysis tabs, which viewers can use to learn more about specific features in the map and generate reports with a variety of analyses on any feature.

Many users are already taking advantage of Map Builder’s impressive capabilities to create their own customized map applications. For example, Kenya’s Ministry of Environment and Natural Resources recently completed a national restoration opportunity assessment informed by their Tree-based Landscape Restoration Potential Atlas created using the Map Builder template. The atlas overlays rivers, land use, and population density with areas marked as having potential for restoration. Check out blog posts by Thomas Maschler and Asa Strong from World Resources Institute about customizing GFW and open data and GIS for more information and examples.

Built with ArcGIS API for JavaScript, Map Builder leverages ArcGIS Online templates as well as the ArcGIS for Server Image Extension for analysis. It features lightweight code with a fully mobile and responsive design, making it accessible even in countries with low bandwidth.


Thomas
Mapbuilder allows users to combine GFW’s geospatial analysis features with data that is important to their local cause and environment. With this highly-customizable tool users can now build web applications to monitor forests in their own backyard. Park rangers can track where forests were cut down as recently as a week ago, auditors can calculate countries’ carbon emissions from forest conversion and companies can find and address points in their supply chains that contribute to deforestation. WRI uses Mapbuilder as a platform for Forest and Restoration Atlases. These applications are published and updated together with partnering national government agencies. The tight integration with ArcGIS online allows our country teams to manage their sites independently and reduces the amount of necessary training and follow up support.

-Thomas Maschler, GIS Manager for GFW Africa, World Resources Institute


Ceres Digs Deeper into Water Impacts of Hydraulic Fracturing

In 2014 Blue Raster created a series of maps for Ceres highlighting drought intensity and groundwater depletion as a result of increased hydraulic fracking in shale basins across the United States. Ceres has now produced the Competition for Water in US Shale Energy Development application showcasing the effects and statistics of fracking on both a National level and by water basin.

Using information for 109,665 well locations from FracFocus  (via IHS) between January 2011 and January 2016, Blue Raster aggregated the total gallons of water usage for 21 basins, and determined the top five operators, states, and counties. Additionally, using data from the Aqueduct Water Risk Atlas from the World Resources Institute (WRI), the percent of wells in areas of high and extremely high water stress is reported. These metrics provide insight into the delicate balance and consequences of water use from fracking against the total water available.

The Competition for Water in US Shale Energy Development application was developed with Esri Leaflet and the ArcGIS JavaScript API.

See the spatial patterns of hydraulic fracking and explore the data today.


Page 13 of 24