Environment

Staying Ahead of the Global Water Supply Shortage

Global water supply is rapidly becoming a topic that crosses international borders and stretches across watersheds, communities, and livelihoods. Well known organizations such as the United Nations, the World Wildlife Foundation and The Water Project all recognize the threat of water shortage on generations to come and that these threats will have effects far beyond environmental. These organizations estimate that:

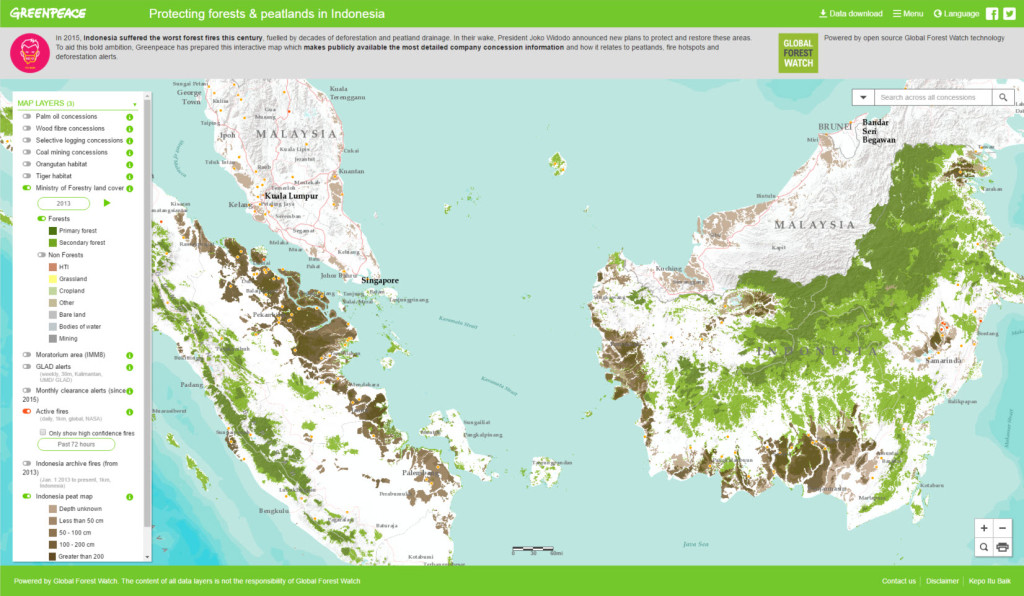
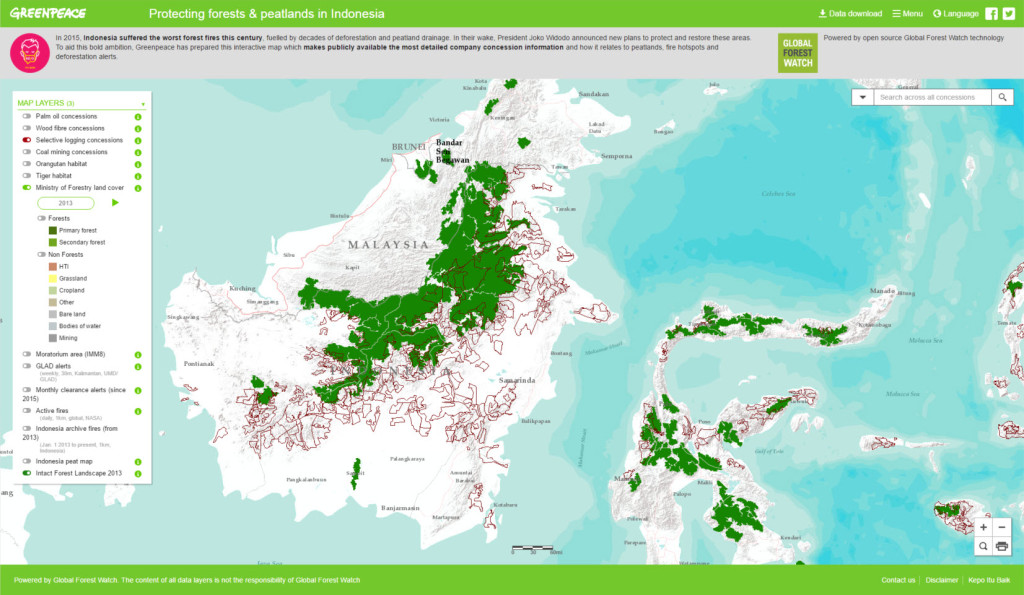
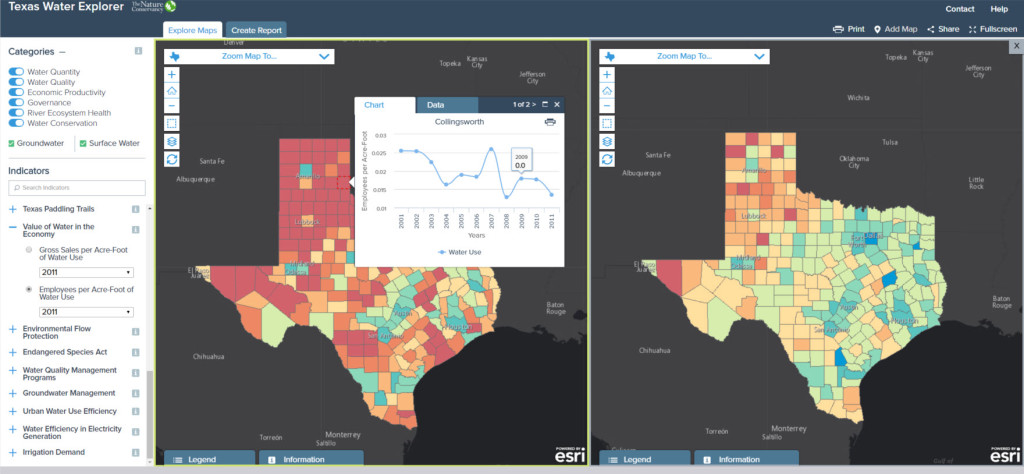
With a clear motive and call for action, World Resources Institute and Blue Raster teamed up to create Global Forest Watch Water, allowing users to quickly identify risks to clean water in areas of deforestation, forest fires and soil erosion and to identify cost-effective natural infrastructure solutions. This public facing tool provides the means for governments, businesses, financing, institutions, and communities to create a plan for action that is educated, sustainable, and effective.

Jasmine

“Global Forest Watch (GFW) Water is a global mapping tool and database that examines how forest loss, fires, unsustainable land use and other threats to natural infrastructure affect water security. Users can drop a pin anywhere on the map to see the risks to nearby water supplies and find resources on how investing in natural infrastructure protection can help alleviate these threats. GFW Water looks to help downstream utilities, businesses, financing and development institutions, researchers and civil society groups quickly identify risks to ample, clean water by providing the data they need for all 230 global watersheds in an easy-to-use, accessible format.”
– Jasmine Qin, Research Analyst, World Resources Institute


The World Resources Institute is partnering with civil-society organizations to support on-the-ground results, using GFW Water information to help them secure clean water supplies. These partners include:

GFW Water leverages the Esri ArcGIS API for JavaScript and ArcGIS Image Extension for Server for its advanced mapping capabilities and the ability to produce on-the-fly analysis for selected water features. The full reports include risk scores for forest loss, erosion, fires, and baseline water stress, as well as number of water intake locations, the presence of dams, and more. The application incorporates the Esri Hydrology Service, which allows for upstream analysis as a user specifies a point placed on a map. ReactJS and Highcharts are used for enhanced user interface features including the incorporation of animated charts and graphs.
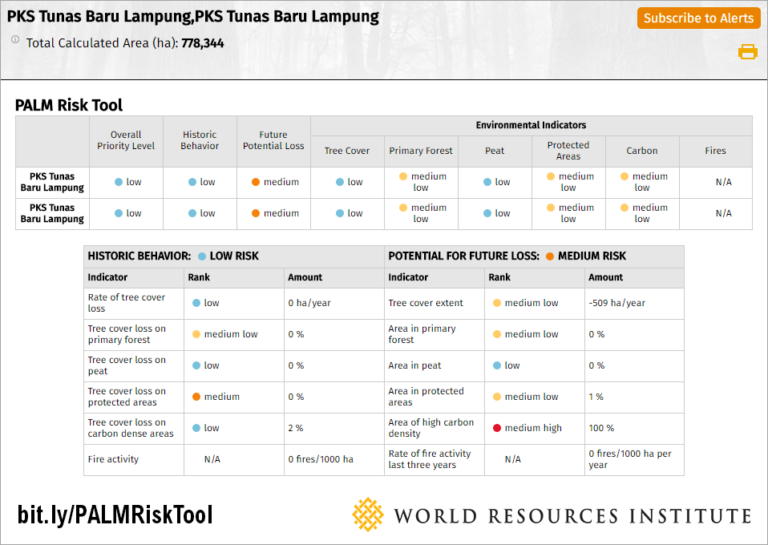
 

New Analysis Tools for Greenpeace

Greenpeace Indonesia has released its latest addition: custom Fires and GLAD (Global Land Analysis & Discovery) Analysis. Users easily create generated reports on active Fires across Indonesia, powered by data from the NASA MODIS Fire Detection Satellites, updated in near real-time. They can also generate reports on GLAD Datasets, which contain 30-meter resolution Forest Loss, adding up to billions of pixels worldwide.

All the Analysis is done on the fly and includes the most up to date data possible. Analysis is available nationally for Indonesia and for selected islands or provinces, and results pinpoint exactly where the highest numbers of fires or GLAD alerts exist. Hotspots are by districts, concessions, areas of peatland, and instances within tiger and orangutan habitats.

These reports are powered by the latest technology, including the ArcGIS JavaScript API, Highcharts to animate the reports, React JS to build the library interface, and ES6.


With the new analysis tool, it’s extremely quick and easy for anyone interested in Indonesian commodities to spot potential problems as they arise. Researchers can interrogate the concession data we’ve publicly released to see which groups or companies have the highest rates of clearance or fire alerts. This can help identify long-term trends and show customers any potential problems with forest and peatland clearance in their supply chains.

-Kiki Taufik, Coordinator of Greenpeace Indonesia’s Forests Campaign


Pinpoint Deforestation with PALM Risk Tool

Global Forest Watch – Commodities is proud to announce the integration of the PALM Risk Tool (Prioritizing Areas, Landscapes and Mills), a groundbreaking tool aiming to eliminate deforestation surrounding palm oil production across Indonesia, Malaysia and elsewhere. With a global data set of nearly 800 palm oil mills, corporations have for the first time the resources needed to commit to deforestation-free palm oil sourcing.


Intan-Sejati-Andalan-report 3To make this tool successful in real-time, the application utilizes satellite-based data alongside regularly updated mill data. Users can select one or multiple mill sites, and analyze data surrounding this location for fire activity, tree cover loss, and high-carbon peatlands. Based on this analysis, rankings are calculated to create a more focused and efficient approach to sustainable palm oil production.

The maps utilize ArcGIS for Server while the code base integrates ArcGIS JavaScript API, Highcharts, and React JS, all working together to power an application that is accessible and reliable. In order to support the advanced analysis done on-the-fly, the application uses the ArcGIS Image Server extension and compute-histograms tools.


sarahlakeCompanies have made ambitious commitments to remove deforestation from their supply chains, yet significant challenges exist to turning these commitments into action. The PALM risk tool helps address this challenge. Commodity traders and buyers can use the tool to identify the mill areas of highest priority in their supply chain in order to intervene and in turn, get the biggest bang for their buck. The tool leverages the powerful data of Global Forest Watch together with dynamic analysis in ArcGIS, allowing companies to analyze their own supply chain — as well as the first-ever mill dataset hosted by GFW — to begin moving towards their zero-deforestation goals.

-Sarah Lake, Corporate Engagement Research Analyst, Global Forest Watch


Greenpeace Indonesia

Blue Raster partnered with Greenpeace and Global Forest Watch (GFW) to help protect one of the world’s most fragile ecosystems: forests. Their threat from fires and deforestation has been characterized by some as one of the worst environmental disasters in recent history. Fires across Indonesia have far-reaching effects on both air pollution and climate change while deforestation depletes the natural forests and changes landscapes for years to come. The Greenpeace Indonesia mapping application fuses the most helpful datasets together and makes them available to the public. Datasets include: detailed concession information including forest cover, fires instances provided by NASA’s Fire Information for Resources Management System (FIRMS), and selected animal habitats. 

Screenshot1

Greenpeace Indonesia allows decision makers to accomplish ambitious goals by getting the latest data in the hands of the public: especially in the hands of people who can act on it. The Energy Desk at Greenpeace further describes the mapping app in their post, “Investigation: Mapping Indonesia’s fires and logging rights”. Additionally, Channel NewsAsia suggests in their publication, “Greenpeace Indonesia launches map to track haze-causing fires,” that the map can be used as evidence in court — this is certainly a game changer.

This application uses the ArcGIS JavaScript API, React JS, and Flux, creating a reliable repository of data that can be viewed and downloaded within the application. Many Indonesian residents are able to have access to data for the first time, and hold land owners responsible for deforestation and illegal fires that have repercussions across Southeast Asia.

Screenshot2


Since the catastrophic fires last year, Indonesia’s president has made commitments to ending the destruction of the carbon-rich peatlands but this will only be possible with free access to up-to-date information on land use and land tenure. In 2011, the Indonesian government promised a single mapping platform to publish this data – One Map – but it now may not see the light of day until 2019 at the earliest. We can’t wait that long, which is why we’ve compiled and released the most comprehensive concession maps available. We worked closely with the team at Blue Raster to combine our data with several other map layers provided by GFW, including fire and deforestation alerts. Together, these data sets provide an essential tool for producers, traders, consumer companies and researchers to monitor activity on the ground in near-real time and – cruicually – see who controls the land on which fires and deforestation occur. Out hope is that the Kepo Hutan maps will spur the government into action and set the standard for the official maps which are so desperately needed.

-KiKi Taufik, Coordinator of Greenpeace Indonesia’s Forests Campaign

Take a Dip in The Texas Water Explorer

Blue Raster has long worked with The Nature Conservancy to tackle complex environmental problems using GIS analysis and expertise. The Texas Water Explorer does just that: transforming Texas water data into interactive, visual maps so that anyone can understand it at a glance.

The first step in creating the Texas Water Explorer was to create a dashboard, giving detailed background information to users learning about all of the water bodies and conservation indicators available. Read about each of the indicators and datasets, such as River Fragmentation or Sector Water Use, or explore each of the geographies across Texas from the Colorado River Basin to the Gulf Coast Aquifer.

Sales_Sidebyside

Once in the explorer, users can view and compare data, for example, River Flow Alteration and Presence of Invasive Species. Indicators have pop-ups powered by Highcharts showing trends in data over time.  Export tools allow the creation of custom reports that can be downloaded as Excel and taken on the go. The Texas Water Explorer uses the ArcGIS JavaScript API and Knockout.js to deliver the large amount of data supplied by The Nature Conservancy.

The Nature Conservancy has called the Texas Water Explorer a “one-stop shop on the current state of water in Texas”, an essential component to informed decision making that will lead to healthy communities, healthy environments, and a thriving economy now and in the future. (TNC Launches Texas Water Explorer)


By 2050, our population is set to double to 54 million and every region in Texas is in search of water to support its fast-growing communities. It’s essential to arm decision-makers with the best information available so they can make sound choices and be good stewards. This tool provides important data that can help Texans support healthy communities, a healthy environment and a thriving economy now and in the future.

-Laura Huffman, Texas State Director for The Nature Conservancy


Page 14 of 24