Environment

Turning Concept into Reality: Green Infrastructure

Water is one of the world’s most pressing challenges.  Faced with the opportunity to find better water solutions for global stakeholders, the Earth Genome, backed by the World Business Council for Sustainable Development (WBCSD), enlisted the help of Blue Raster and Arizona State University to create the Green Infrastructure Support Tool (GIST). The interactive web mapping application provides high-level wetland-restoration site analysis and portfolio prioritization to address water scarcity and was recently launched at GreenBiz 2016.

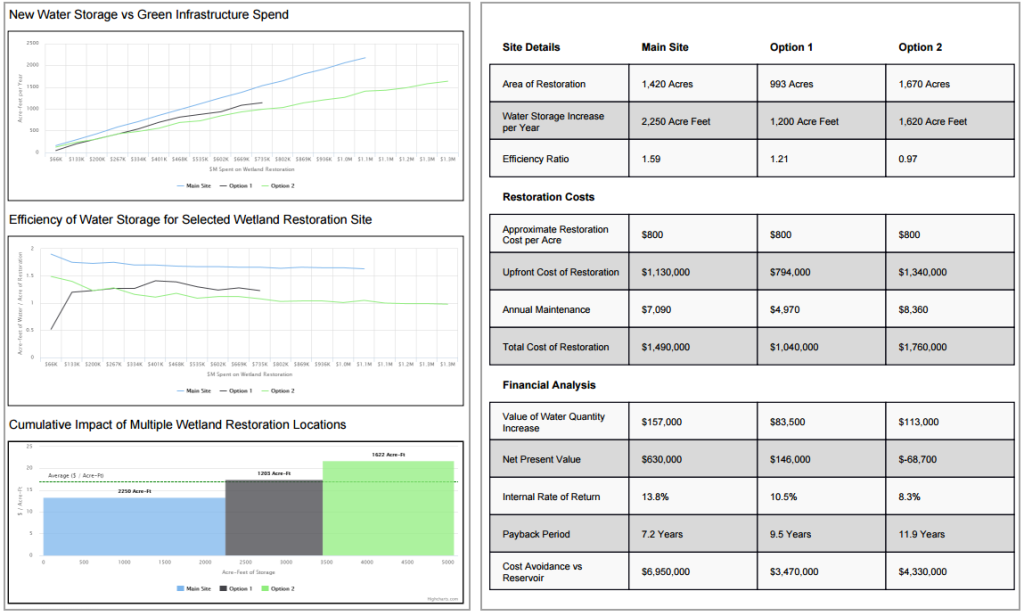
The tool employs criteria-based screening via spatial data and end-user inputs, enabling end users to weigh options across the region and compare relative value and costs. Financial metrics include net present value, area cost curves, and environmental return on investment. Together, they help determine the best “bang for buck” restoration sites to provision water across an entire basin. The application combines environmental data such as wetland areas, biodiversity and land cover with business initiatives that consider both investment and costs for various land-cover restoration options, resulting in a truly spatial decision support system.

GIST Site Definition

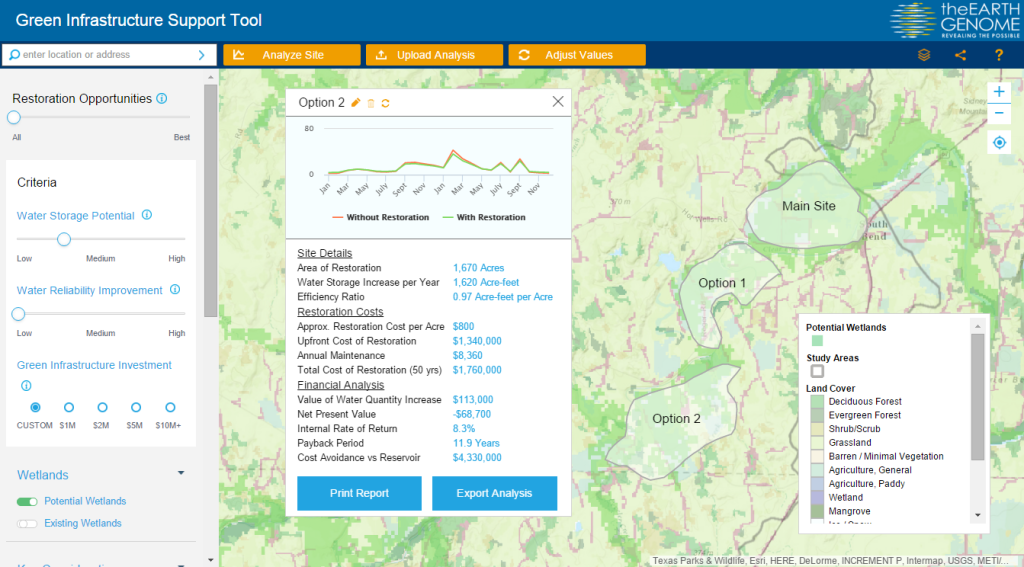
Key in the development of GIST was the ability to present data in an easy-to-use way and to incorporate millions of points of disparate environmental data. As a result, corporations, governments, water authorities, resource engineers or anyone interested in potential water restoration are able to create their own development sites with corresponding financial analysis. The reporting engine supports comparing multiple sites, determining the optimal green infrastructure investment, based on landscape characteristics and hydrologic modeling.

GIST Analysis


The ability to create these custom reports is made possible by on-the-fly statistical/histogram calculations leveraging the ArcGIS Image Server extension. The GIST also uses the ArcGIS JavaScript API and Highcharts to supply the data and charting throughout the application.


“Blue Raster was a terrific partner. The Earth Genome exists to unite data, science, visualization and end users to solve some of the planet’s most wicked problems. Blue Raster was essential in pulling off GIST, what we believe is a breakthrough tool that puts environmental data, translated via world class science, into the hands of real decision makers. I’m most pleased with the work Blue Raster did on the visual interface. The tool is elegant yet simple: anybody can use it to find the opportunities that make most financial sense for their organization.”

Earth Genome – Glen Low
Co-Founder, The Earth Genome


New Climate and Land Use Tools for EPA

The Environmental Protection Agency (EPA) partnered with Blue Raster to release a new version of ICLUS (Integrated Climate and Land Use Scenarios), richly visualizing climate and land-use model scenarios.

DensityProjection

The ICLUS model incorporates:

  • Climate change variables
  • Commercial and industrial growth
  • Enhanced land use and impervious surface coverage relationships

EPA intends to use the results of this first phase of modeling to facilitate investigation of additional impact scenarios including water and air quality. This research will enable more sophisticated model runs evaluating effects of projected climate change on population growth and economic development.

To let users compare and contrast maps, the application features a side-by-side comparison view. Users can easily view up to four maps in parallel, revealing similarities and differences in density and distribution. The maps can be synced to the same dataset, year, and/or location.

Charts2

ArcGIS for Server 10.2 and the latest JavaScript API power the upgraded application. ICLUS leverages the powerful visualization components of D3.js and Highcharts.

EPA ICLUS Application

Visit and explore the ICLUS tool today.

Unless We Act Now: UNICEF

Unless We Act Now ReportBlue Raster is proud to announce a collaboration with The United Nations Children’s Fund (UNICEF) to contribute to Unless We Act Now: The Impact of Climate Change on Children – a report published by UNICEF at the annual Conference of Parties (COP21), also known as the 2015 Paris Climate Conference. COP21 is a renowned conference that brings together international voices representing government and UN Agencies, NGOs and civil society to assess climate change and set universal agreements and goals for reducing climate change and adapting to the changes that have already begun.

The Unless We Act Now report leveraged geospatial analysis of current demographic, environmental and projected climate data, in order to direct aid to child populations across the world as they face unforgiving changing weather patterns.

UNICEF has made putting children first their mission, and although climate change is an imminent threat to populations across the world, it is children who are hit the hardest as their bodies are most vulnerable to change. Being able to understand where these 2.3 billion children are was the first step, but taking this further to understand how environmental conditions such as droughts, floods, and extreme heat effect food and water supply, sanitation, and the spread of disease is made possible through GIS analysis via ArcGIS Desktop and ArcGIS Online.

Climate Change affects children in unique ways — these maps show where Children and Climate Change intersect.

unicefMap1COP21 is a fantastic opportunity for UNICEF to present our “Unless We Act Now: The Impacts of Climate Change on Children” report, as climate change will be of critical importance when protecting and preserving the future livelihood of children around the world. Blue Raster was with us every step of the way during the data analysis and cartographic development, and their timely responses, adaptive and analytical methods, and personal connections to spatial data subject matter experts working around the world helped make this project a resounding success.

Nicholas Rees, Policy Analysis Specialist, UNICEF New York

A map poster featuring the analytical and cartographic work was then featured at the 2016 Esri User Conference and won the ICA and IMIA Excellence in Cartography award, and was selected for publication in 2017 Esri Map Book, Volume 32.

“The Impact of Climate Change on Children by UNICEF was recognized by the judges for it’s powerful, stark design on a relevant, topical subject. This work delivered a high impact, strong message with clarity and effective simplicity.”

Esri Insider, July 14, 2016

A special thanks to:
Trevor Croft, DHS Program   |   Paul Reig and Tianyi Luo, World Resources Institute   |   Carmelle Terborgh, Esri
Deborah-Balk, The City University of New York   |   Susana Adamo and Kytt MacManus, CIESIN Columbia University

children

Blue Raster Presents Emerging Hotspots of Global Tree Cover Loss

Amazamon Web Services

Blue Raster is excited to attend and present at the 2015 Earth Observation in the Cloud Demo Day on November 10th. Michael Lippmann and Jon Nordling will be presenting on our work with Amazon Web Services (AWS) and Earth Observation Data. The talk will highlight how big data analysis provided by AWS is helping pinpoint emerging hotspots of tree cover loss around the world. The project is part of a collaboration between Blue Raster, the World Resources Institute (WRI) Global Forest Watch Team and the Esri Big Data Team. For more information about the event, visit Amazon’s Earth Observation in the Cloud Demo Day site.

Behind-the-scenes look at producing the maps:

Blue Raster at Amazon's Earth Observation in the Cloud Demo Day


See the full presentation here:


Development Alert! Awareness of Infrastructure Projects

The World Resources Institute (WRI) and the Jamaica Environment Trust (JET) announced today the launch of the newest tool from WRI’s Access initiative, Development Alert!. Built by Blue Raster, the free, mobile-friendly site provides the public with greater access to information about development projects affecting the environment and public health. The site plots approved and proposed large-scale development projects along with overlays of protected areas, fisheries, forest reserves and land cover so users can easily identify projects in or around environmentally sensitive areas.

Development Alert Homepage


Development-Alert-On-iPhone-Map

In Jamaica, Development Alert! is helping promote transparency and public involvement in projects including the trans-shipment port in Goat Islands. The project is expected to flatten the Goat Islands to develop a $1.5 billion trans-shipment port.

Using the map of Jamaica in Development Alert!, members of the public can see that this project is not only located in a protected area but is also within a forest reserve and Special Fisheries Conservation Area.

See the Goat Islands Project in Action.


Carole Excell, Project Director, The Access Initiative“The dynamic new website Development Alert! Jamaica is the result of a close collaborative approach with Blue Raster. What has been accomplished is an innovative new advocacy tool for environmental defenders. It’s a first not only in Jamaica but in the entire Caribbean. We could not have asked for better partners in this project and hope to bring this website to other countries around the world.”

Carole Excell, Project Director of The Access Initiative at WRI


The site is developed on WordPress for easy content management by JET, and is integrated with ArcGIS Online and ArcGIS Server via the JavaScript API for mapping capabilities. Learn more and visit Development Alert!.


Page 15 of 24