Water

Solving the Water Balance Equation for California

Drought has been a significant concern throughout much of the western U.S., threatening the livelihood of farmers and communities across several states. When years of drought stretch on, groundwater pumping often becomes the most viable option for the agriculture sector, leading to a negative water-balance and increasingly sparse water availability. Local water authorities are scrambling to recharge the groundwater supplies for their districts’ agricultural needs.

Fortunately, a new tool for their arsenal is now available – the Groundwater Recharge Assessment Tool (GRAT), developed in partnership with The Earth Genome and Sustainable Conservation. Through a prioritized use of dedicated recharge basins, fallow field recharge, and on-farm recharge sites, it may be possible to balance the water budget and reverse the damage caused by years of over-pumping. On-farm recharge is a relatively new approach and requires an understanding of what crops are being grown, and how flood-year waters could be applied during select weeks of the year when high-flow water is available. Currently much of that water runs off the landscape and eventually into the ocean, but on-farm recharge may provide the key to capturing that water by recharging underlying aquifers.

To calculate the best use of on-farm recharge and the impact on the water budget, GRAT allows irrigation districts to run an unlimited number of wet-year scenarios, ranking of field types based on soil and crop characteristics, and detailed cost calculations.

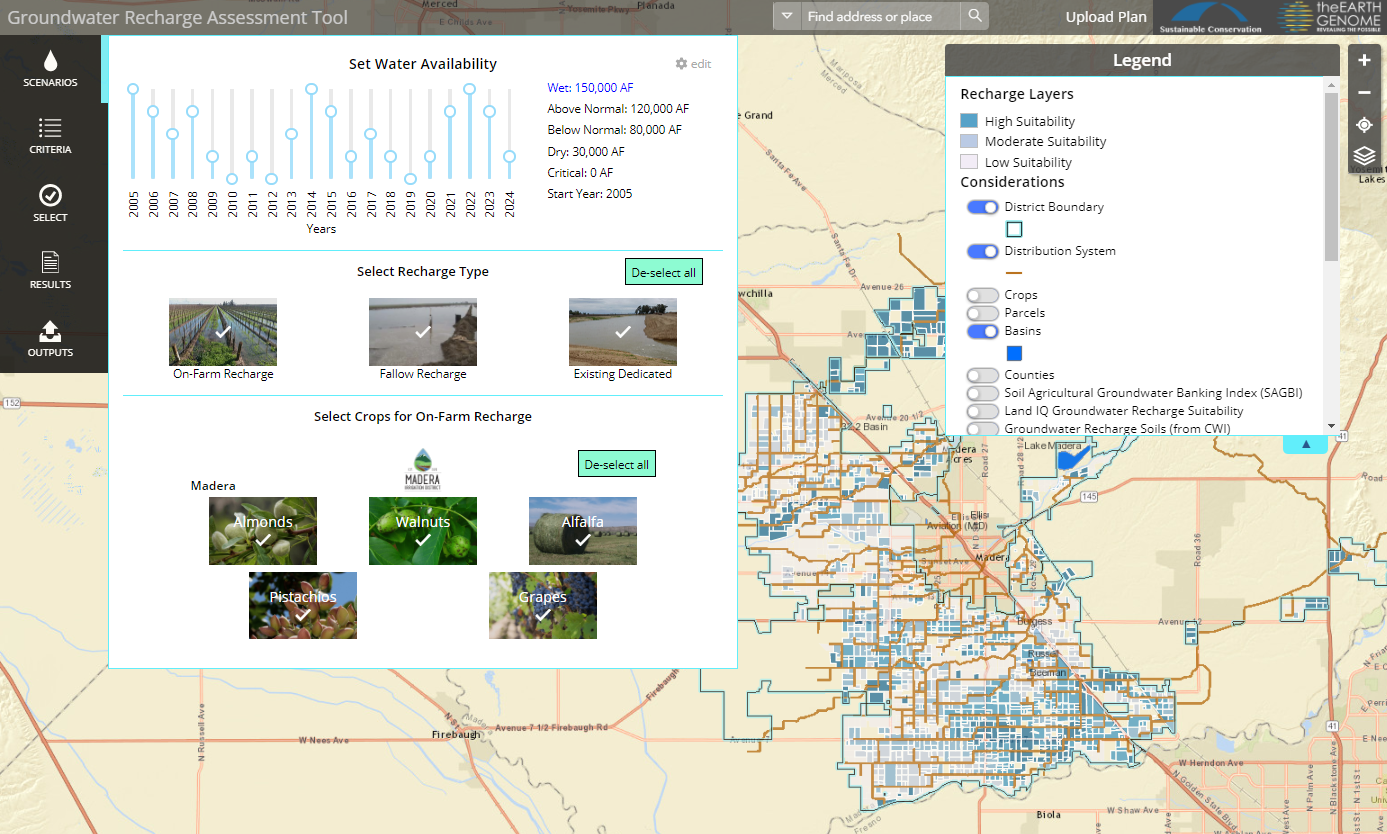
Setting detailed criteria requirements helps to optimize the selection of sites based on an irrigation district’s individual needs. Weighted indexes are calculated dynamically using a number of geophysical variables linked to each criteria.

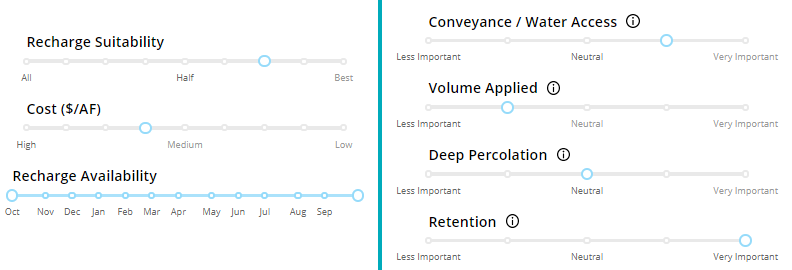
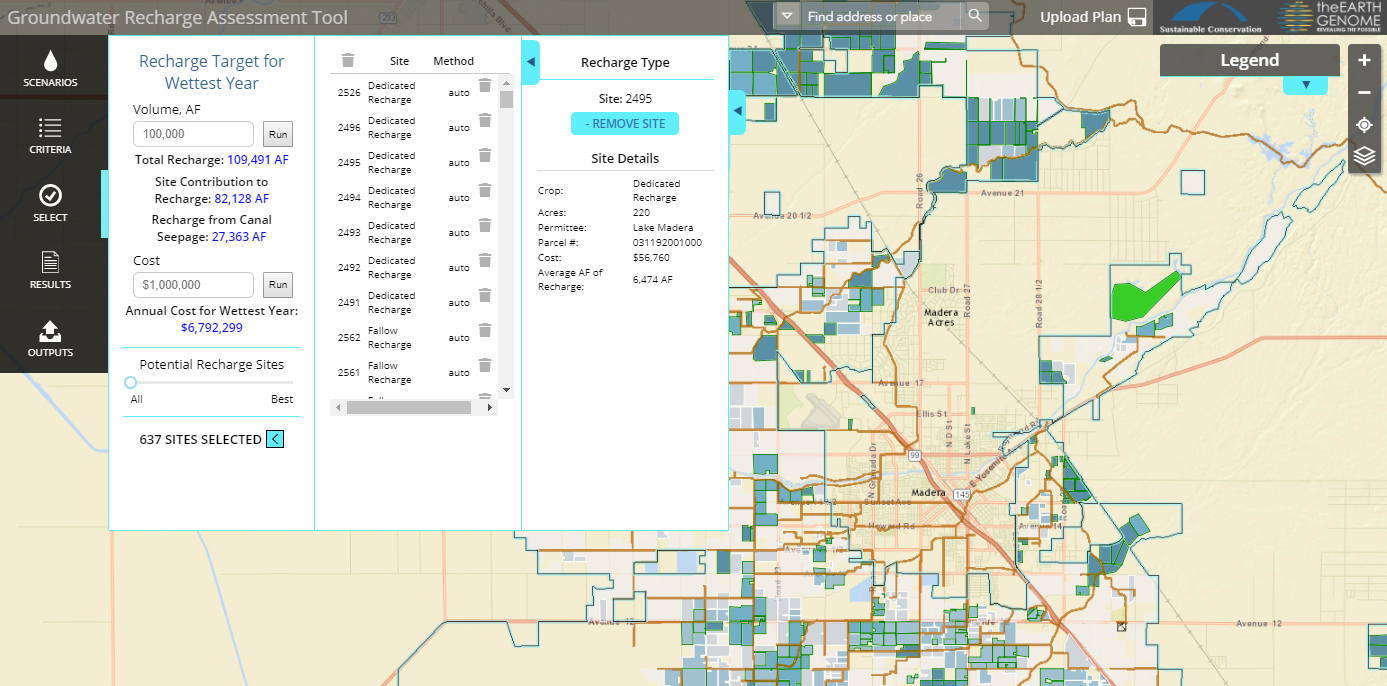
GRAT allows the automated selection of sites up to a target recharge volume or cost ceiling, and then the manual removal or selection of additional sites based on local expert knowledge.

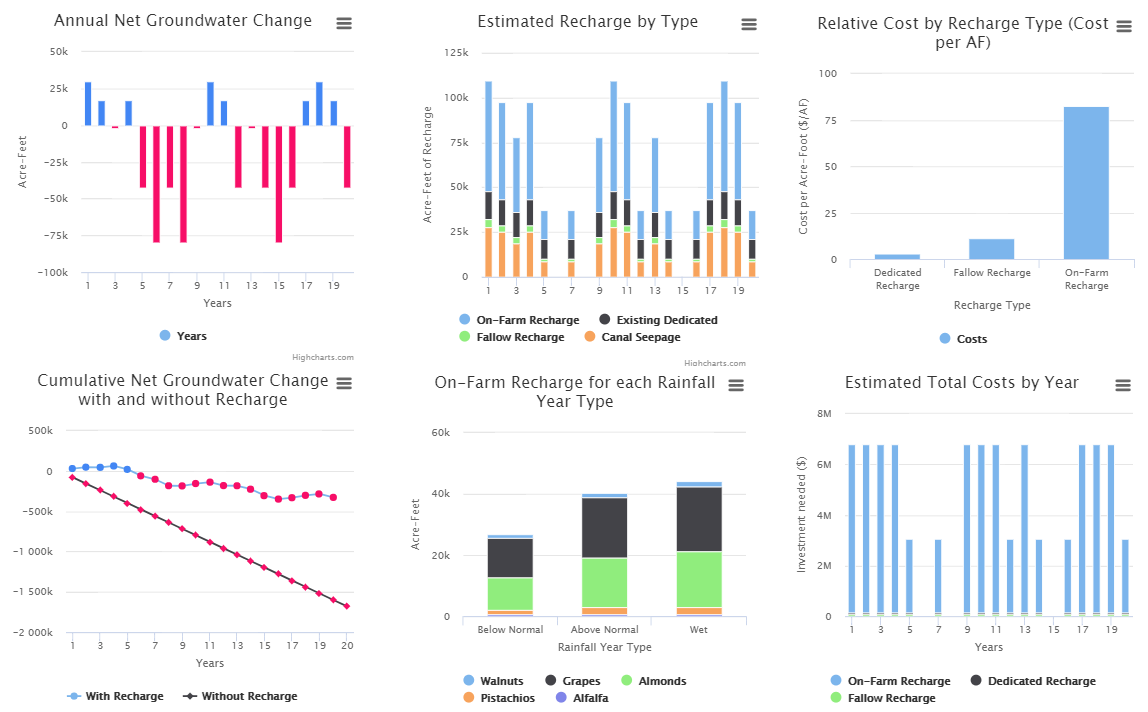
Advanced, dynamic charting gives real-time updates of groundwater balance and estimated costs based on selected sites. Once the balance has been reached, the option to save the plan can be used to share results with decision makers throughout the district.

GRAT was co-created in collaboration with Madera Irrigation District and Tulare Irrigation District.  It is also now being rolled out to other interested Groundwater Sustainability Agencies (GSAs) in California, to support their Sustainable Groundwater Management Act (SGMA) reporting requirements.


See What’s New with the Texas Water Explorer!

More than a third of the native fish species are at risk in the Rio Grande basin. With rising concerns about water resources, the Texas Water Explorer is delivering data and analysis critical for sustainable management of resources like the Rio Grande. The Explorer is the The Nature Conservancy in Texas’  (TNC TX) definitive source for exploring water health, use, governance, and quality in Texas. Blue Raster worked closely with TNC TX to augment the Explorer this year with a new Ecosystem Health indicator summarizing native fish species diversity and conservation, compiled in collaboration with the Fishes of Texas Project, as well as newly released 2014 and 2015 water use data from the Texas Water Development Board.

Texas Water Explorer Map of Percent Native Fish Species in Conservation Need by basin

Rio Grande Basin has highest percentage of native fish species in conservation need

In addition to the data enhancements, we’ve added a fresh new look for the static content particularly catering to users on mobile devices. We have increased the “scannability” of the wealth of summary information on the website. Scannability was coined in the UI/UX world as the ability to draw in a reader’s attention on a page as they skim over it. Our aim with the new design is easy readability from your phone for the more content-heavy pages.

The Texas Water Explorer has been a very useful tool for The Nature Conservancy in communicating important Texas water issues to a variety of audiences, and we’re excited to enhance its content and usability even more.”             

The Nature ConservancyRyan Smith, Freshwater Ecologist,
The Nature Conservancy in Texas

Visit the Texas Water Explorer to see how data and analysis come together to make a positive impact on statewide water resources.

Redesigned Aquifer Summary Page

Redesigned Aquifer Summary Page

A New Chapter on Tsunami Design

New design provisions for tsunami loads and effects have been developed by the ASCE 7 Tsunami Loads and Effects Subcommittee (TLESC), and are included in the just-released 2016 edition of the internationally recognized loading standard ASCE 7, Minimum Design Loads and Associated Criteria for Buildings and Other Structures (ASCE/SEI 7-16). This resource and accompanying data was developed over a 34-month period by a subcommittee of almost 30 members, along with the contributions and review of numerous other state, national, and international stakeholders. To provide the authoritative distribution of this tsunami design information, Blue Raster and the Structural Engineering Institute of ASCE have created the ASCE Tsunami Design Geodatabase application.

Offshore Tsunami Amplitude Analysis

The ASCE Tsunami Design Geodatabase application provides insight into the first national, consensus-based standard for tsunami resilience for use in the states of Alaska, Washington, Oregon, California, and Hawaii. Structural engineers are already being asked to incorporate tsunami-resilient designs in various critical building and facility structures in the five western states, The profession and the affected communities now have a comprehensive consensus on loading and design standards for buildings and other structures.

Transect of Elevation

The new tsunami design zone maps define the coastal zones where structures of specified risk would be designed for tsunami resistance. Easy access to this data through the ASCE Tsunami Design Geodatabase application is imperative for the resiliency of our coastal infrastructure.

Keeping Trees Green with DDOT

Blue Raster and the District Department of Transportation (DDOT) worked together to create and launch a mobile-friendly DC Tree Watering Application. Keeping trees green in our city is a full time job for contractors, but their efforts can be significantly augmented by community involvement and the public’s willingness to water trees during the hot, dry summer months. The first two years of a planted tree’s life are critical, and every watering event increases the survival rate of the trees.

The application is powered by spatial data services hosted by the Office of the Chief Technology Officer (OCTO) ArcGIS Server, and a webmap in ArcGIS Online that can be easily updated or customized by DDOT in the future. A story map is also included that gives further information about each of the tree types in DC. Watering events or reports that trees need help are recorded by the application and used by DDOT to determine which trees may need additional attention. The option to upload a photo of people caring for their trees will let the community show DDOT how much they appreciate their urban canopy as well as people’s willingness to help keep our trees happy and healthy for generations to come.

Photo of Mayor Muriel BowserMayor Muriel Bowser launched the new DC Tree Watering Application during her recent Ward 6 community walk. “We are committed to embracing smart technology across city government, and with the launch of the new DC Tree Watering App we are encouraging all District residents to help support our urban forestry,” said Mayor Bowser. “Watering is the easiest and most affordable way for residents to help, and this app will allow us to coordinate our efforts.” 

Check out the DC Tree Watering Application, find your house, and see if there’s a tree in need outside that could use your help!


Discover Cambodia’s Watersheds and Ecosystems with WESTool

Blue Raster is proud to announce a partnership with Winrock International that has resulted in a completely redesigned Watershed Ecosystem Services Tool (WESTool), allowing users to explore the interaction of ecosystem services, land uses and socioeconomic factors across Cambodia’s landscapes. By combining advanced science with intuitive maps and tools, the WESTool offers valuable information at the local, regional and national scale to support decision makers and land managers who wish to understand and balance the value of remaining forests with development goals.

The WESTool estimates land use change, carbon stocks, greenhouse gas emissions, sediment and nutrient loss, changes in river water quality, impacts on biodiversity, population, access to market, and general agricultural production data at the national and local levels in Cambodia. This provides a valuable resource for anyone interested in learning more about the the impacts of land use change on forest ecosystem services, people and the economy in Cambodia. The tool provides for a more comprehensive understanding of the implications of land management decisions by offering information on both the historical impacts of land use change and the current value of ecosystem services.

As part of this project, Blue Raster redesigned an existing application using modern JavaScript and HTML frameworks, integrated openpyxl to create a custom summary analysis excel file based on user-specified areas, and optimized existing web services using Esri’s ArcGIS for Server to achieve a fast and responsive web experience.

“As the lead developer of the WESTool for Winrock I’m incredibly grateful to have partnered with Blue Raster on the development of the WESTool.  It is rare to have a team of developers that both have the technical chops to get the job done and the creative vison to take your idea and make them a reality.  Thanks BR!”

– Michael Netzer, Program Officer, Winrock  

Be sure to check out the interactive mapping application today!


Page 4 of 7