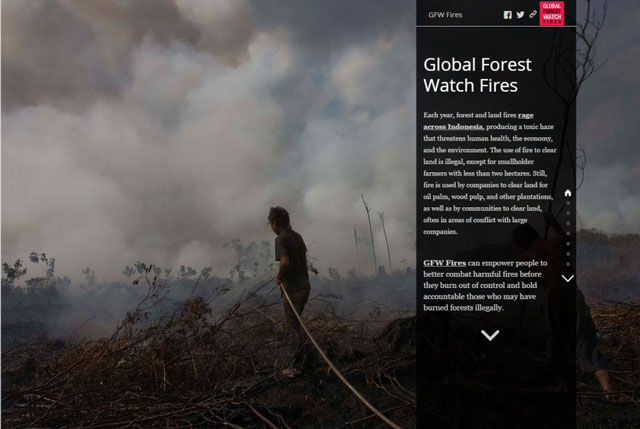
Global Forest Watch (GFW) recently launched a new story map highlighting the functionality behind GFW Fires, an online platform for monitoring and responding to fires in Southeast Asia. The story map walks users through the platform and explains its growing role in the fight against land and forest fires.
Created using ArcGIS Online and the Map Journal Builder, the story map is organized into eight sections that users can scroll through. Each section highlights a different feature of the platform, and tells the story behind how it is helping government agencies in Indonesia and other countries monitor and respond to fires with more precision and speed. It also explores the environmental, economic, and social implications of these fires. From Digital Globe and Landsat high-resolution satellite imagery to wind and air quality data, the platform empowers people to combat these fires before they burn out of control and enables greater accountability where crimes of illegal burning may have been committed.
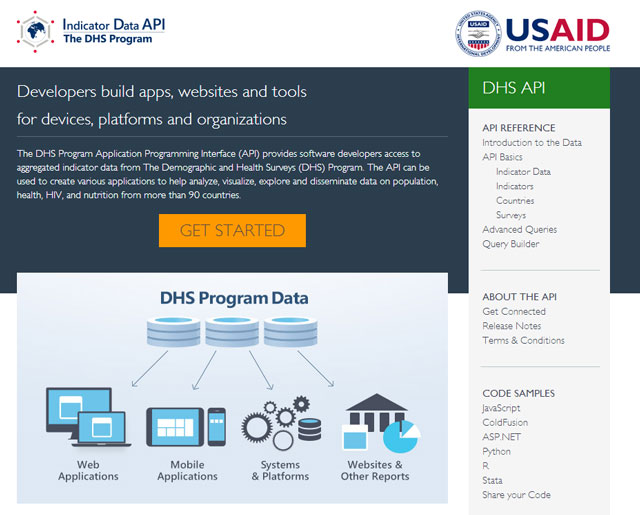
The API was developed by Blue Raster on the ColdFusion Web Application platform. Developers can query the DHS data using both a RESTful interface, which allows selecting parameters including countries, indicators, and surveys, as well as a conventional query-based interface which provides advanced options for obtaining more customized results. For those looking to query large sets of data, the API offers additional parameters that control the format, citation, and version information. Additionally, JSON, XML, CSV and HTML output formats are supported to provide users with flexibility.
In the spirit of openness, the DHS Program has put together tips and code samples in JavaScript, ColdFusion, .NET, Python, R, Stata, and more to help users get started. You can even register to be a DHS API partner which allows you access to a larger number of entries returned per page and assistance in application development.
“The DHS API provides a new level of access to DHS data. Blue Raster has produced a wonderfully simple but powerful tool that will power both the DHS website and STATcompiler as well as users and developers own applications.”
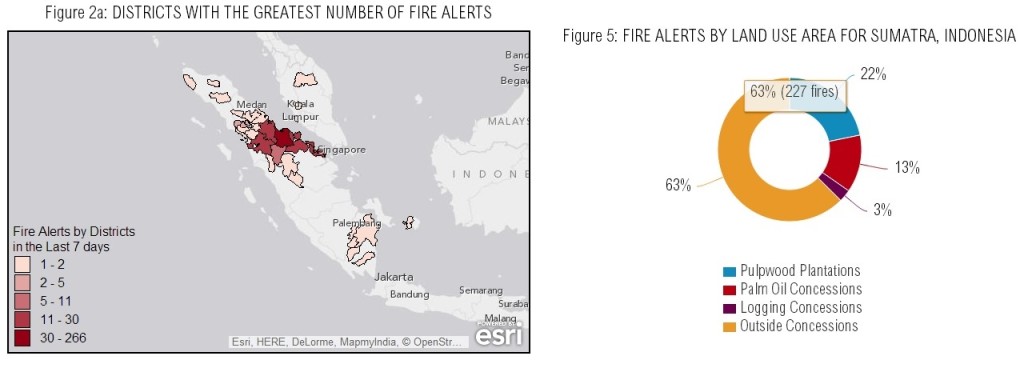
Fires across Indonesia are one of the largest threats to the life, environment, and people who rely on Indonesian land. To address these risks, Blue Raster partnered with the World Resources Institute (WRI), Esri, DigitalGlobe, Google and others to launch the Global Forest Watch-Fires (GFW-Fires) online platform. GFW-Fires was built using Esri’s ArcGIS Server and ArcGIS API for Javascript. The platform contains comprehensive information on the locations of fires, land use, land cover and conservation areas.
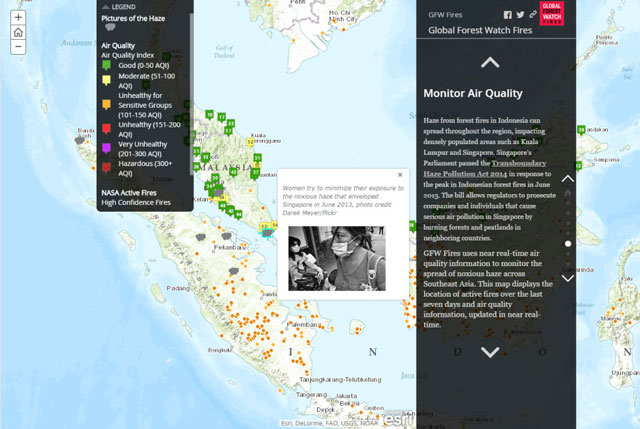
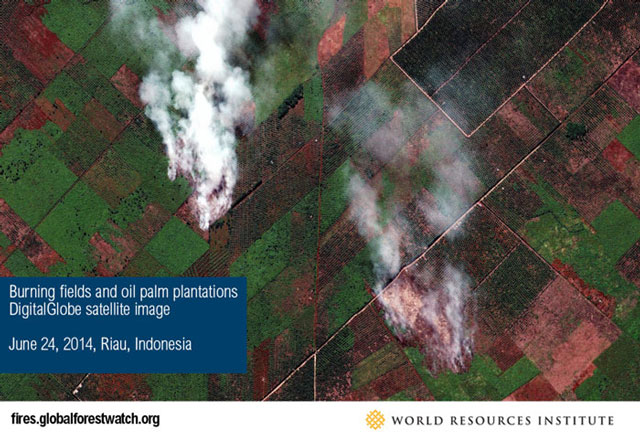
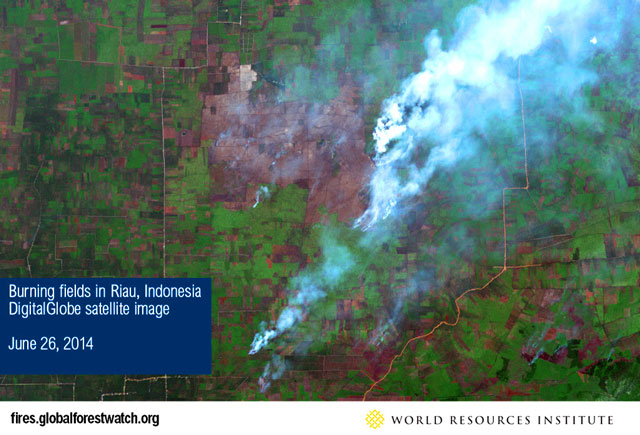
Users can view locations of fires on peat lands, which has become imperative due to environmental and health implications, including haze and smoke that result from burning on high carbon soils. FORESTS News reports that, “Peat fires were the largest single source of greenhouse gas emissions in 2005 (larger than energy).” What makes this application truly exceptional, is the addition of DigitalGlobe’s remarkable 50 centimeter resolution satellite imagery, giving a bird’s eye view sharp enough to see each tree on the ground.
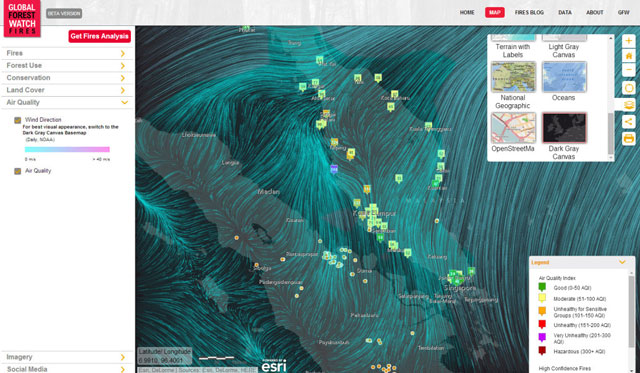
With the help of NASA’s MODIS data and imagery, used to locate the fires, DigitalGlobe can now be directed to a location to take super high resolution images. This imagery is so clear that you can easily distinguish between healthy and dead vegetation, the type of vegetation effected, view and draw burn area boundaries, and detect previously existing burn scars. This allows accountability to be assigned to the fires, as one now has the tools to investigate where and how these fires have started. What was once a point on a map can now be confirmed through close to real-time imagery. In addition, the user can then view wind direction and air quality data, key components of determining who will be effected downwind.
Often, a fire may be located in Indonesia, but the toxic air is carried to a neighboring island in Malaysia or Singapore. By utilizing the ArcGIS Image Extension for Server, the platform computes and provides statistics on a selected area of interest, and allows the user to export the analysis in a report. In order to get this information to the public, GFW-Fires also offers an SMS Alerts system, using the Twilio platform. The addition of this capability has made it possible for Global Forest Watch to achieve their goals of responding to environmental hazards faster than ever before. It is now possible to locate a fire, confirm and analyze the fire, and get the word out through SMS Alerts in a matter of minutes.
Using the extensive amount of data available on the platform, users have the capacity to voice their concern and request change towards a sustainable future free of dangerous smog and land conflict.
Susan Minnemeyer, WRI’s Senior Mapping and Data Manager for Global Forest Watch, says:
“The website puts near-real time data and analysis tools in the hands of citizens and decision makers to learn more about developing fires crises and effectively respond. Working with Blue Raster, we were able to develop the site over only a few weeks and automate analysis our GIS team had been doing in house.”
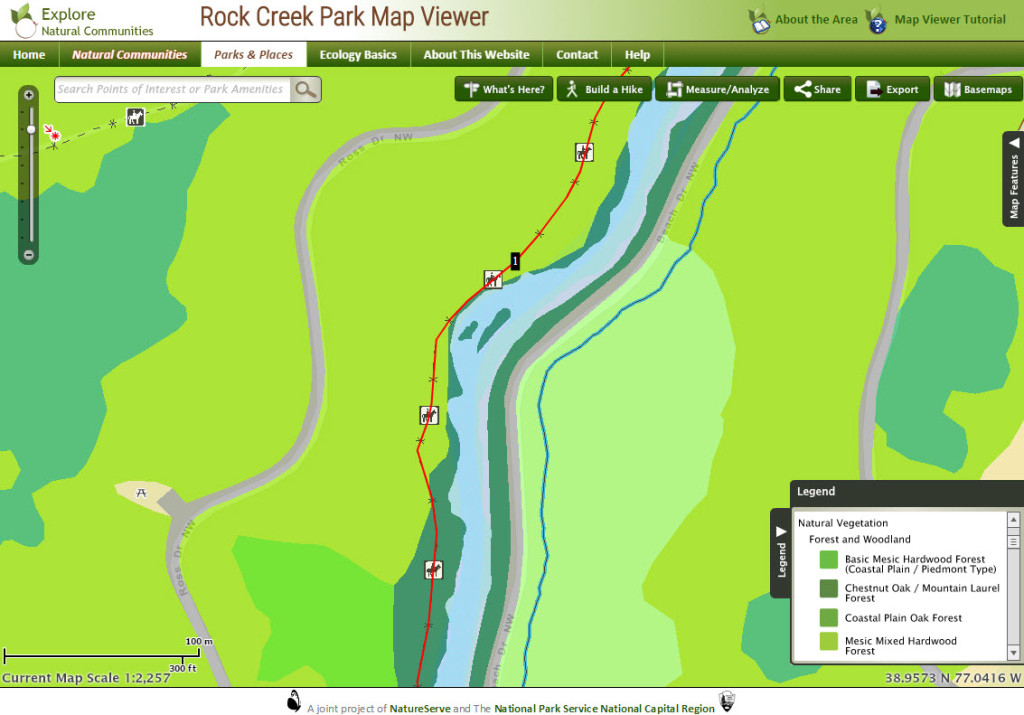
At the heart of Washington D.C. lies Rock Creek Park, America’s oldest and largest urban national park. Spanning 2,000 acres and encompassing the Georgetown Waterfront, Meridian Hill Park, and Thompson Boathouse, Rock Creek has been attracting visitors for decades. But with over 32 miles of paved and unpaved trails, historic sites, and much more, it can be difficult to figure out how to get the most out of your park visit.
To help with this challenge, NatureServe developed the Rock Creek Park Map Viewer. Built by Blue Raster, the interactive map acts as a field guide focused on highlighting the natural communities of Rock Creek. The Map Viewer arms park visitors with the knowledge and skills to “read” the natural landscape and hit the trails with a personalized hike route. Using the application’s “Build-a-hike” tool, users can create custom hikes and print reports on what they will see on the trail. Resource management specialists, park rangers, and interpretive staff also use the site to better manage natural areas and generate reports on areas of study.
The Map Viewer is funded and supported by a partnership with the National Park Service. Currently released to highlight Rock Creek Park, the viewer is designed to easily expand to other locations across the country. Blue Raster built the Map Viewer using ArcGIS for Server and ArcGIS Desktop.
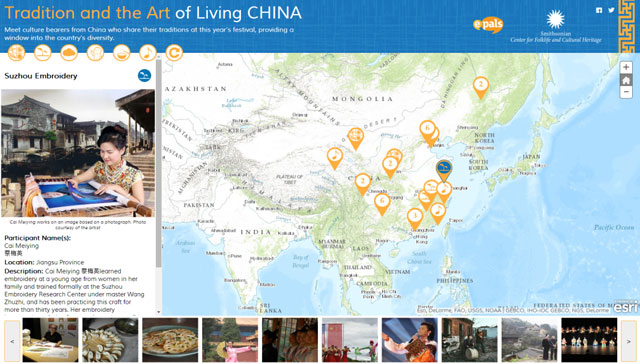
The second in a series of story maps for the Smithsonian Center for Folklife and Cultural Heritage, Tradition and the Art of Living China highlights the culture bearers appearing at the 2014 Folklife Festival in Washington D.C. Built by Blue Raster and Cricket Media, the map allows users to experience the artistry and heritage of those keeping China’s diverse traditions alive.
Although the map has since been removed from the web, it was created using ArcGIS Online. The story map integrates photographs of the Folklife Festival participants and their work. As a result, it offers a comprehensive look into the cultural heritage of China. From calligraphy and pottery, to martial arts, users worldwide can explore the unique stories of these tradition bearers.