Filter

Smithsonian’s Virtual Field Trip around the Globe‏

The Smithsonian Center for Folklife and Cultural Heritage and Cricket Media, an education media company and global learning network, recently invited kids from around the world to identify and interview people who exemplify important traditions in their communities, then asked them to document and present their stories.

Traditions-of-World-640

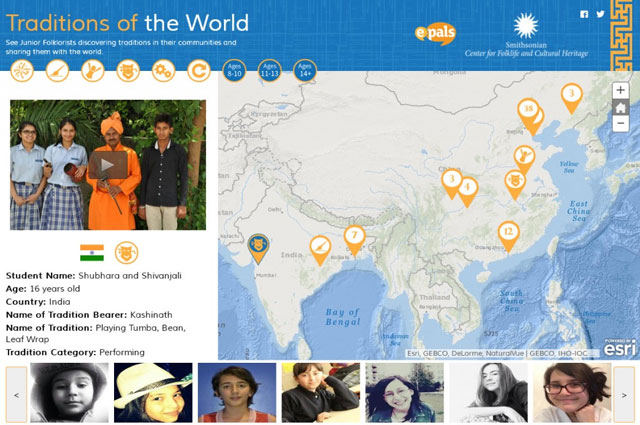
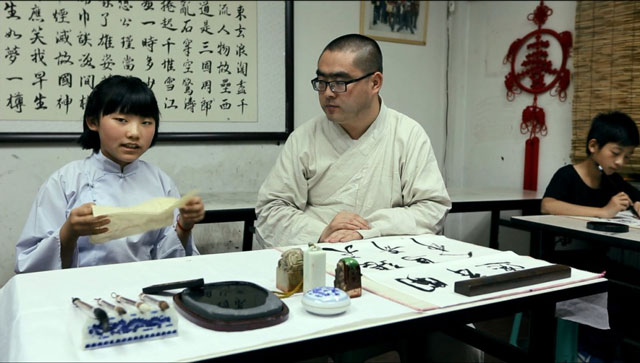
Cricket Media and Blue Raster created the Traditions of the World story map using ArcGIS Online, highlighting the top video submissions from kids ages 8-18 from around the world.  The result is an interactive virtual field trip with lively hosts that include a 9 year old boy from West Bengal India showing traditional saris being hand woven and students in China documenting everything from dumpling making to martial arts.

The challenge was launched in coordination with the Smithsonian Center’s annual June-July Washington D.C.-based Folklife Festival and extends the folklife experience to millions of students globally. The Story Map has since been removed from the web.

“The challenge inspired students to explore the richness of their local traditions and unique stories of tradition bearers, and the map created by Blue Raster captured this amazing student work in an engaging way that will preserve these traditions for generations to come,” said Cricket Media CEO, Katya Andresen.  “It’s a truly unique, global digital museum, curated by kids.”

Traditions of Calligraphy with Ruochen

GFW Commodities – Tools for Greenhouse Gas Emissions

A new initiative from the World Resources Institute (WRI) and the Roundtable on Sustainable Palm Oil (RSPO) aims to shed light on how individual oil palm concessions affect forest information that can empower companies to manage their forests and supply chains more sustainably. Global Forest Watch-Commodities (GFW-Commodities), a new platform produced by Blue Raster combines the RSPO’s maps of certified sustainable palm oil production sites with global forest data like tree cover loss, forest clearance, locations of primary forests and legal land classifications. Armed with these new maps and knowledge, companies can reduce the risk that the palm oil they purchase contributes to deforestation.

Global Forest Watch-Commodities built by Blue Raster

WRI analysis has shown that companies, communities, NGOs and different levels of government often have different information about forest use. These maps will act as a universally available, coherent and current source of information for any of these above groups to utilize in their work to make palm oil production sustainable for the environment and the communities that rely on it.

Global Forest Watch-Commodities built by Blue Raster

GFW-Commodities was built on Esri’s ArcGIS Server and ArcGIS API for JavaScript. It leverages the Image Extension for ArcGIS Server, to compute, analyze and provide statistics on tree cover loss over time, near real time forest clearing and fires within selected areas of interest.  The analysis features come out-of-the-box with Esri’s Image Extension for ArcGIS Server. Satellite data including Landsat and MODIS are mosaiced and allow for analysis on-the-fly as users explore their areas of interest. 

Key features of each tool:

  • Suitability Mapper
    • Ability to set own suitability criteria based on a range of environmental factors
    • Identifies degraded areas as alternative to development on forest areas
  • Forest Analyzer
    • Detailed land cover data, include data layers on forests, tree cover, and peat lands all important to zero deforestation goals and climate change strategies
    • Additional data layers on protected areas and population density
  • RSPO Support tool
    • – Never-before accessible maps of certified areas for palm oil production
    • – Analysis of forest change on certified areas
    • – Analysis necessary for RSPO compensation procedure

Features of all three tools:

    • Option for users to upload their own shape file for analysis
    • Download data and results for further analysis

The Global Forest Watch platform is at the forefront in its field and will continue to grow and evolve with its use, applying technology for a sustainable world. Read more about the project and WRI’s efforts towards sustainability in Wired magazine – “How a New Map of Palm Oil Plantations Could Help Save Rainforests.”

Videos of Application:

Featured at Esri UC 2014

Tutorial by World Resources Institute

Atlas of Forest Landscape Restoration Opportunities

The world has lost almost half of its original forest cover, largely tied to accelerated population growth and agricultural expansion. Although forests are quickly disappearing, there is a tremendous amount of unused land that if restored, could support woodlands. Through the Atlas of Forest Landscape Restoration Opportunities, it has been found that more than 2 billion hectares (about 8 million square miles) of land worldwide have the potential to be restored, many of which are located in unexpected regions.

Blue Raster and the World Resource Institute created an online mapping application helping users find suitable land for sustainable agriculture. Sustainability and Restoration are key components of saving our environment, so these map projects are extremely useful tools.

Forest Landscape Restoration Opportunities Map

The Atlas also shows restoration potential for individual countries and regions. For example, Cambodia’s tropical forests have been damaged by illegal logging and plantations giving it the highest percentage of land in the world (30 percent) with opportunity for wide-scale restoration.  Many opportunities for restoration lie in the northern portion of the country due to low population density. The areas of land highlighted in red represent deforestation that has occurred within the last decade.
Map Layer Samples
Built using the ArcGIS API for JavaScript and ArcGIS Server, the application allows analysis of potential land use and can help professionals better understand and visualize actions, such as forest restoration, that need to be taken in order to save resources that we all rely on.

Suitability Mapper: Finding Sustainable Palm Oil Sites

The power of GIS as a tool to help manage our planet’s natural resources is limited only by the insightfulness of our questions. Fortunately, more timely and detailed data becomes available every year, so we are free to ask an ever-wider range of questions, such as:

  • In relation to agriculture, what factors affect our ability to sustainably produce crops, and how do these factors change across the landscape?
  • Where should agriculture expand, and where should it retract?

Suitability Map inside GFW Commodities

Blue Raster, along with partners World Resources Institute (WRI) and Sekala, has developed an interactive web application allowing users to customize criteria for sustainable agriculture and find sites for sustainable palm oil across Indonesia.

Upon entering the Suitability Mapper, users visualize various layers superimposed on the Indonesian landscape including elevation, hill slope, rainfall, and soil acidity. WRI provides a two-color layer showing the distribution of areas deemed “potentially suitable” (purple) and “unsuitable” (yellow) for sustainable palm oil production.

suitability layers

Taking analysis a step further, the user can adjust the criteria for this suitability layer by adjusting controls linked to each palm oil variable. In the screenshot below, I have adjusted the suitability analysis to increase the mandatory distance from conservation areas and water resources. With my custom analysis complete, I can use drawing tools to summarize the results for a specific area. Results include the area’s legal status, amount of suitable area, distance from nearby roads, legal status, and whether an oil palm concession already exists in the location.

Suitability Map inside GFW Commodities

The Suitability Mapper was built on top of Esri’s ArcGIS Server and ArcGIS API for JavaScript. Using the ArcGIS Image Extension for Server, we are able to analyze and compute accurate suitability maps in realtime based on user-supplied criteria. Instead of investing large amounts of time in software development and maintenance, we were able to use the out-of-the-box features of Esri’s Image Extension for ArcGIS Server to achieve the goals of the project. This platform  will also make it easier to add more and better data as it becomes available, to continually improve our analysis, inform key stakeholders, and make better decisions.  

Suitability Mapper is part of the Global Forest Watch platform which has many new features coming soon with the launch of its Commodities analysis tool.  Stay tuned for more information and launch dates soon. 

Ceres Maps Analyze Drought and Ground Water Depletion in Shale Development Areas

With hydraulic fracturing and horizontal drilling on the rise  in the United States, many regions have become at risk for water availability. To help highlight these areas, Blue Raster created a series of Hydraulic Fracturing & Water Stress maps for Ceres using Esri’s ArcGIS Desktop software and Adobe Photoshop. Through these maps, users can view eight regions of intense shale development in the United States and Canada, and the degree to which these areas are under stress.

Ceres Drought Monitor Map and Shale Energy Development

Featured in CERES’ latest report: Hydraulic Fracturing & Water Stress: Water Demand by the Numbers, the maps provide investors, lenders, and regulators with sustainable recommendations for minimizing their water demands. With more than 55% of U.S. wells located in areas amid drought, and 36% percent in areas experiencing groundwater depletion, the maps serve as resources for ensuring a long term sustainable strategy for industries in shale energy development.

Ceres Drought Monitor Map and Shale Energy Development

To learn more about the project and to view the maps, visit Ceres’ Hydraulic Fracturing & Water Stress page.


Page 53 of 66