Our Work

Blue Raster helps you tell your story through interactive
mapping technology. Make your message clear, exciting,
and user-friendly for both mobile and web platforms.

Filter

Templeton Roots & Shoots Prizes: Honoring International Changemakers Who Are Making A Difference

Blue Raster is proud to announce another project from our long running collaboration with The Jane Goodall Institute.

Among Jane Goodall's many vital programs is Roots & Shoots, with the mission to empower young people to affect positive change in their communities.

In 2023, JGI collaborated with the John Templeton Foundation to award the Templeton Roots & Shoots Prizes.
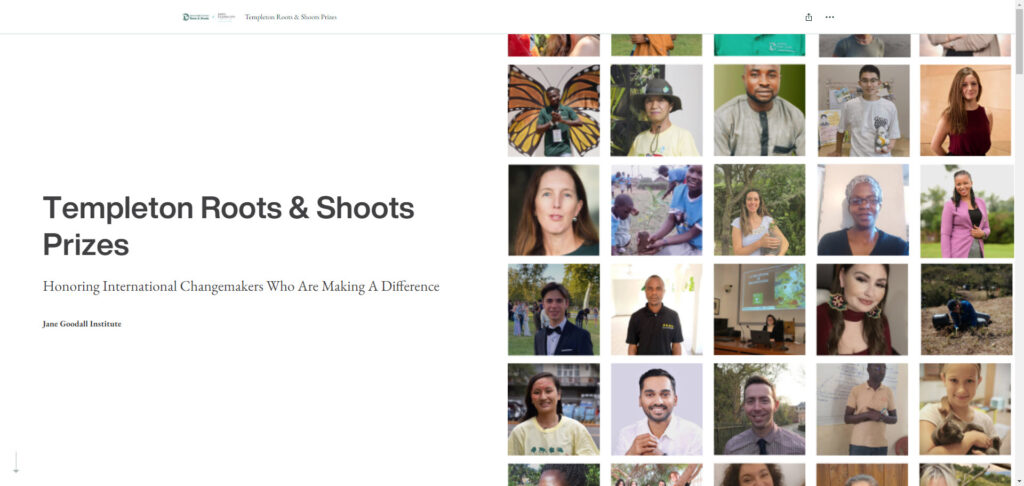
Jane Goodall Templeton StoryMap

From the JGI website: "The Templeton Roots & Shoots Prizes are an extension of the partnership between JGI and the John Templeton Foundation to elevate the extraordinary efforts of visionary youth leaders and their adult mentors worldwide.  Awardees were selected based on their exceptional work with Roots & Shoots at the intersection of science, compassion, and community – specifically those who exemplify curiosity and wonder and the pursuit of knowledge, as well as the expression of compassion towards people, other animals and the environment we share."

When Erin Griffin, Director of Partnerships, Jane Goodall Institute-USA sought a novel way to showcase the 30 winners of the inaugural Templeton Roots & Shoots Prizes she turned to trusted partner Blue Raster and the concept of an ArcGIS StoryMap.

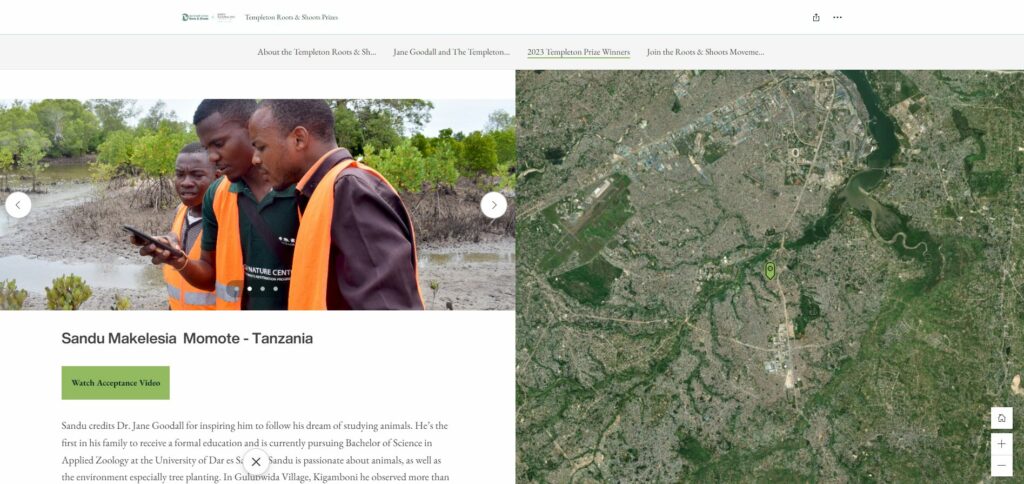
The StoryMap showcases the 2023 winners and features an interactive map, videos and a brief write up of each winner and their vital contributions.
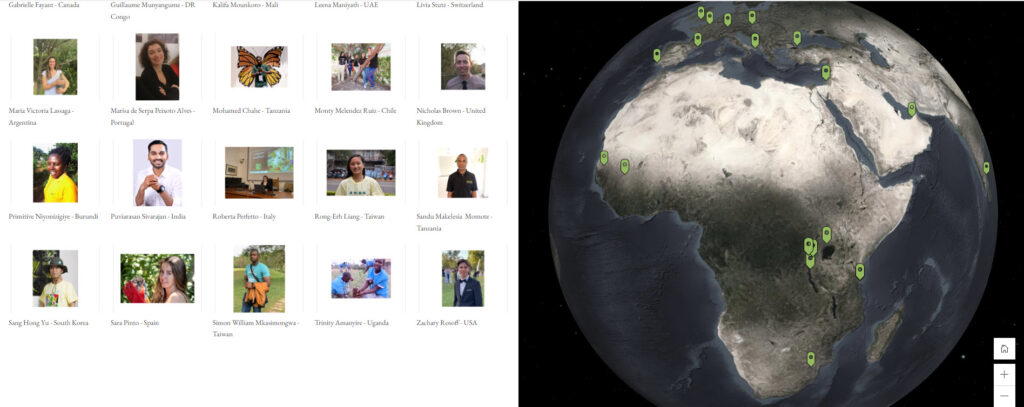
StoryMap screenshot

Blue Raster built several StoryMaps for The Jane Goodall Institute. The platform is ideal for visual story telling, with or without a map based visualization.

Check out the Templeton Roots & Shoots Prizes StoryMap, honoring international changemakers who are making a difference today!
Templeton StoryMap

Ready to tell your story?

Contact Us

  • This field is for validation purposes and should be left unchanged.

2022 Esri UC Top Takeaways

Our Esri UC Recap

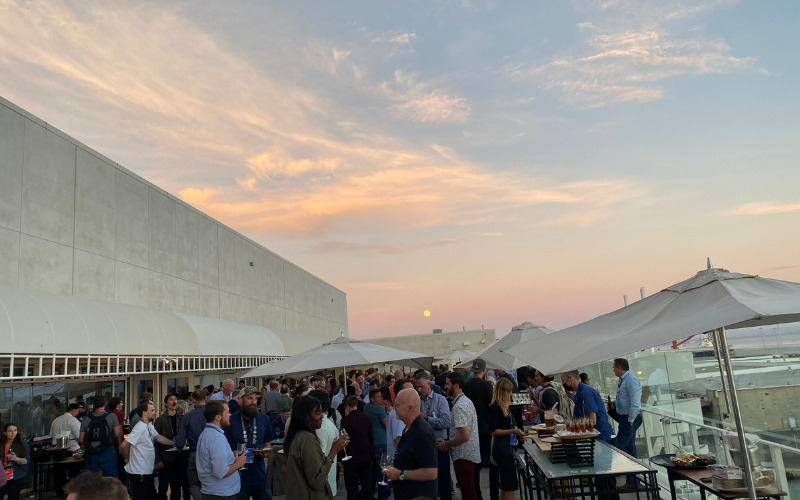
Last week Blue Raster attended the largest GIS event of the year: the annual Esri User Conference in San Diego, CA. The event gathered almost 15,000 in-person attendees from around the world and over 16,000 digital attendees! Our team came back buzzing about new releases, captivating presentations, and all things ArcGIS. We’re excited to share our experience and what we learned at the 2022 Esri UC! 

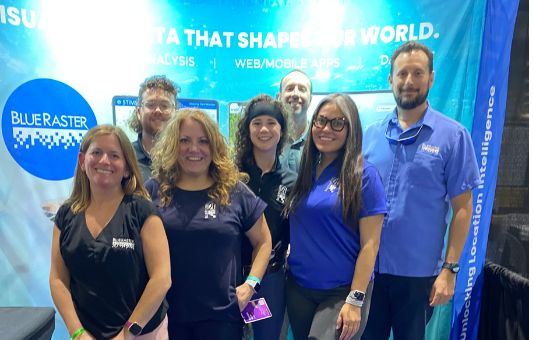
2022 Esri UC Blue Raster photo
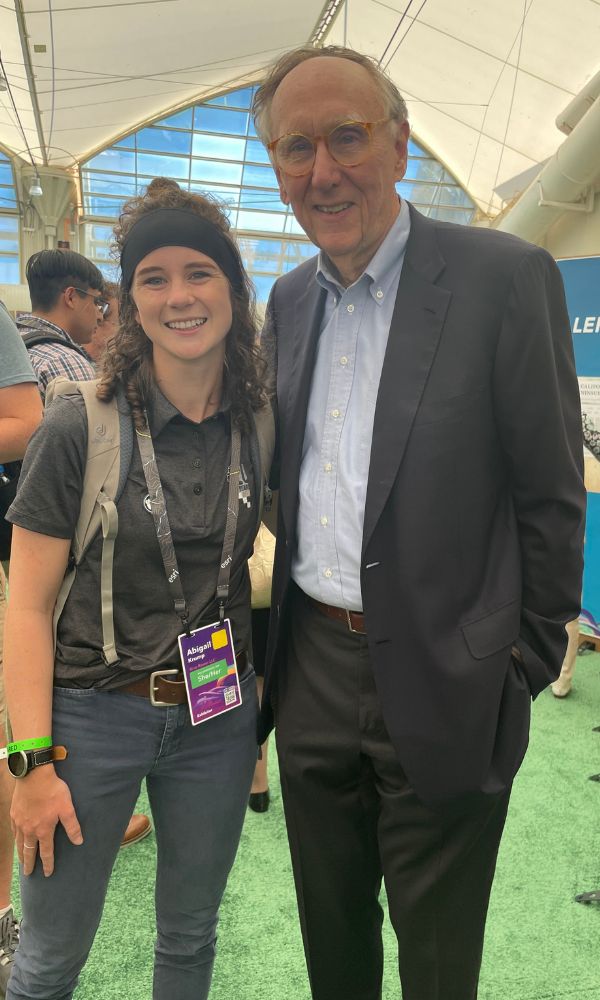
Jack and Abigail at UC

With ideas flying and new technologies being unveiled, here is what’s new and what our team is excited for: 

  • New field applications are coming out! Our GIS Analyst Abigail Krump is interested in how Quick Capture is building out in complexity and expanding what users can do to provide accurate data. Additionally, new Survey123 capabilities are exciting as a user can now annotate images that are taken, speeding up workflows and adding a level of detail in data capture.  
  • At the UC Plenary Session, the entire crowd erupted with excitement about ArcPro Catalog updates that enable you to see when an item was last modified.  
  • New ArcGIS Dashboard updates including being able to download your source data got us excited and our clients are ready to implement the new changes! 
  • Seeing the ArcGIS Online Imagery demo gave us many ideas for how some of our customers can create their own imagery analysis.  
  • New Microsoft Power Automate updates about ready to use flows and the 25 new ESRI templates got the wheels spinning for our team.  
  • Our GIS Analyst Andrew Patterson is excited for the new Field Map updates that enable complex computation utilizing Arcade within the app. 
  • New data is being published to the Living Atlas to symbolize by feature rather than by the entire layer, enabling a user to produce effective and visually appealing maps. 

We'd love to talk with you and share what we learned at this year's User Conference. Contact us today to set up a call! 

GIS - Mapping Common Ground

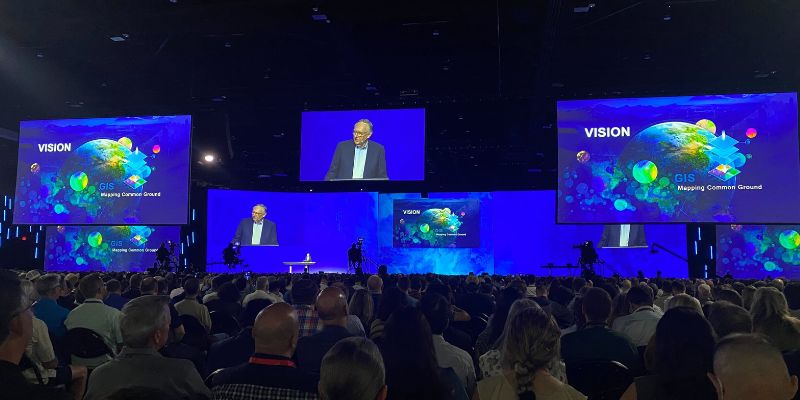
This year’s event kicked off with a Plenary session hosted by Jack Dangermond, Founder and CEO of Esri. We heard from a range of inspiring leaders, including Deanne Criswell from FEMA and Ronan Donovan from National Geographic. The reoccurring theme of the plenary was GIS—Mapping Common Ground, using it as a tool for helping solve challenges in important arenas like climate research, conservation, disaster management, and more. 

2022 Esri UC Plenary

It was exciting seeing David Hayes's talk at the 2022 Esri UC about The National Climate Taskforce focus on climate and clean energy, with an emphasis on equity for disadvantaged communities. A prototype online portal built by Esri aims to provide a central hub of climate-related information for anyone to access. State and local governments can find policy maps, climate data, and links to funding sources to fight climate change.

More Plenary Highlights

The plenary showcased incredible work using ArcGIS Knowledge which enables users to visualize relational data in and outside of space using graph science. Andrew believes there are a lot of opportunities to use this incredible technology with many of our projects.

Disaster response was another important highlight of the plenary, with Esri outlining all of the disaster response solutions and identifying their separate use cases. Our team got to sit down with the disaster response team to hear a summary of what is new and what’s on the horizon with the disaster response program. We learned there is a new national and global level disaster response hub with curated data sets for disaster response deployment.

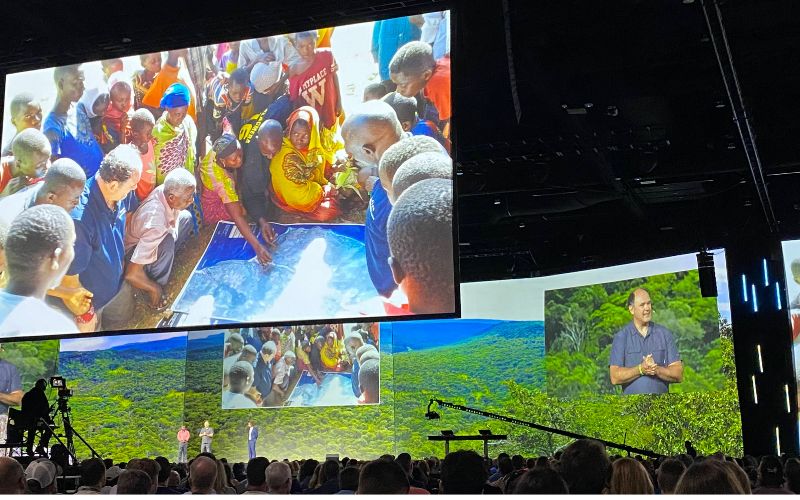
UC JGI talk
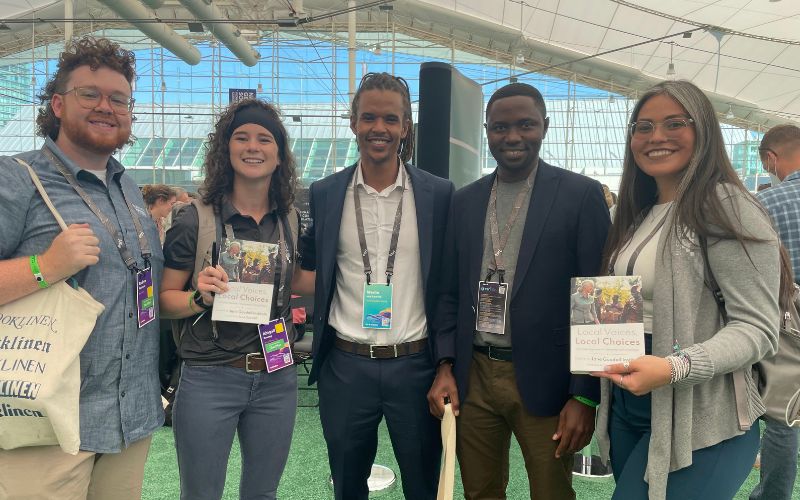
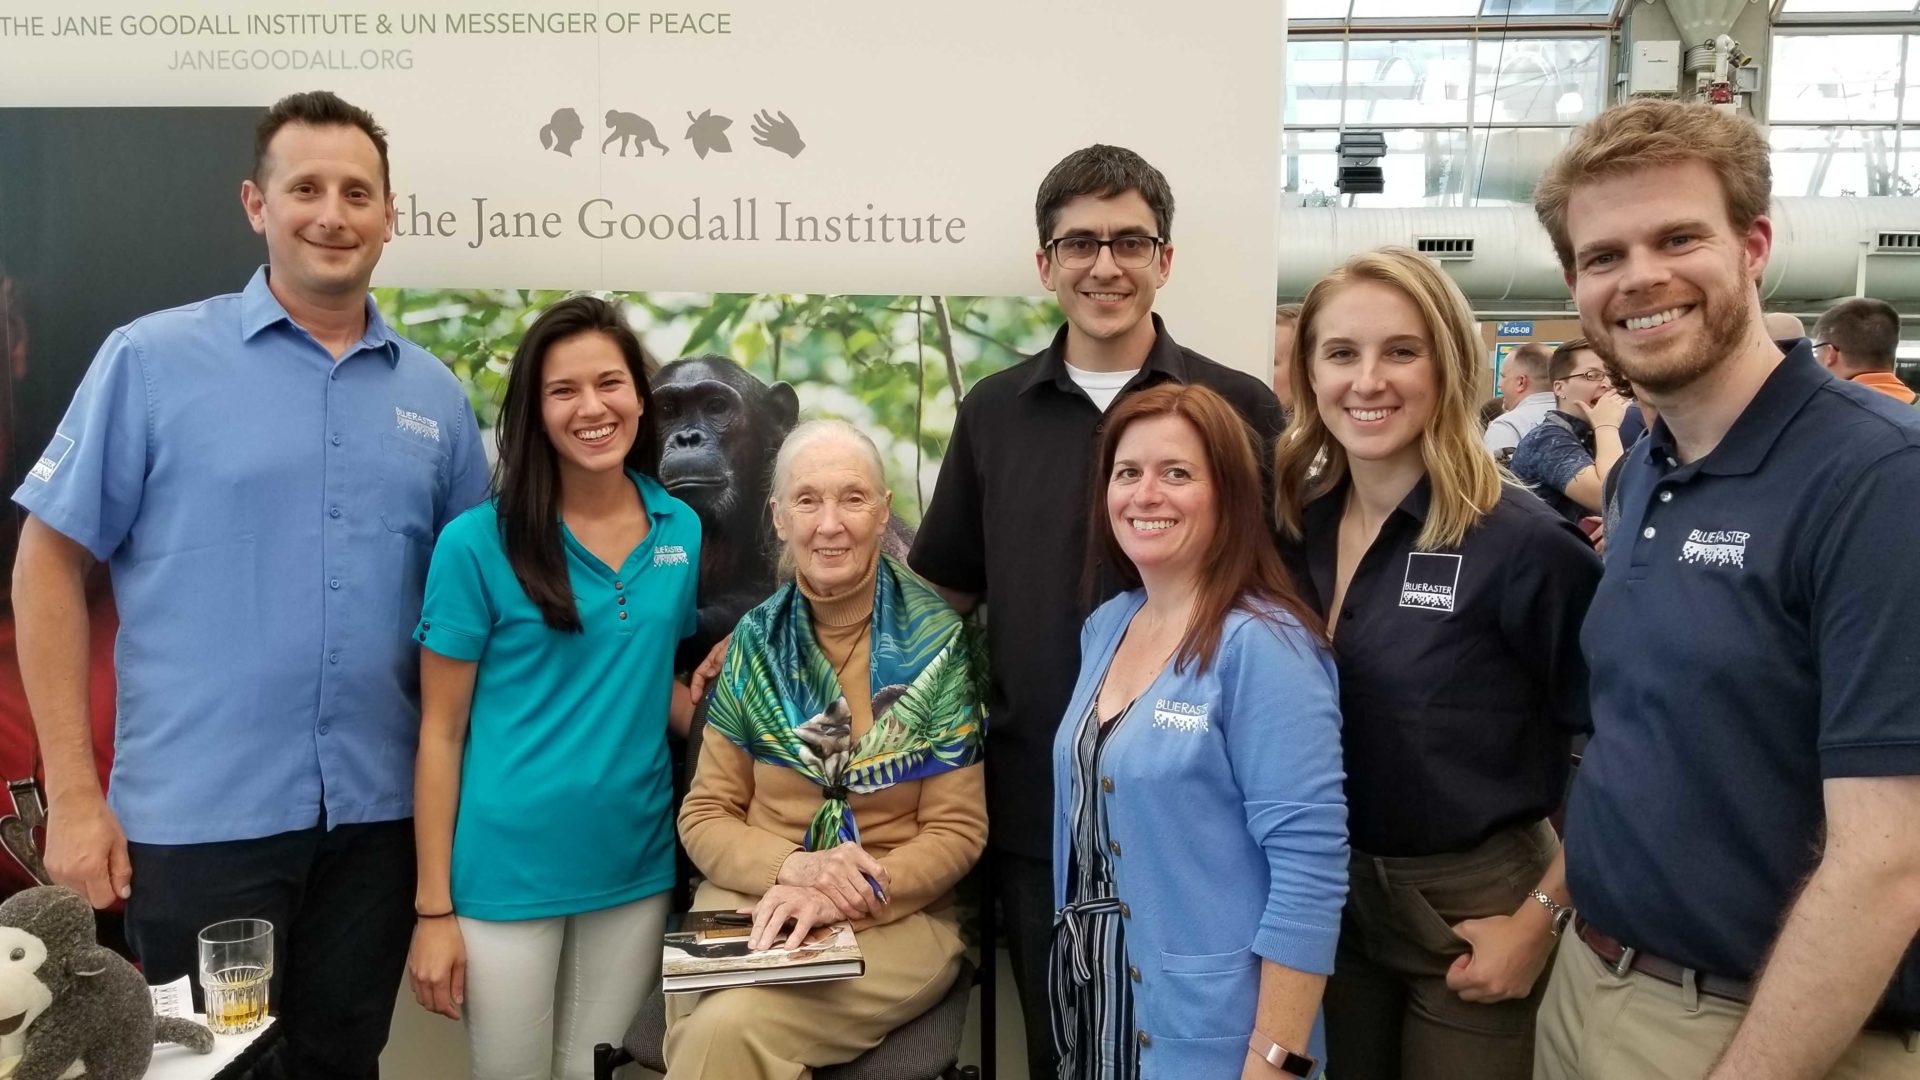
JGI team and Blue Raster

Our work with the Jane Goodall Institute was showcased on the main screen! Blue Raster GIS Analyst Abigail Krump felt that her experience at the UC and plenary brought a lot of context to the purpose of the project as a whole. Abigail came home from San Diego with some serious ideas for how to continue improving the project.

“Seeing it in the context of the community and on the ground work was really refreshing. Alice Macharia, head of African programs of JGI, thanked me for my work which was an incredible honor.”

Abigail was honored and excited to have the opportunity to meet the Jane Goodall Team that she works with remotely. For her, it has been a lifelong dream to work with JGI.  Abigail was impressed by how JGI presented a strong understanding of where conservation science in GIS is moving towards to better serve the communities they are working with. 

2022 Esri UC Highlights

Sustainable World Spotlight

The Sustainable World Showcase is a hub for GIS users working to make strides to support the planet, people, prosperity, and peace. GIS applications under the Sustainable World umbrella included climate change, conservation, disaster response, education, global development, humanitarian, nonprofit, racial equity, and social justice. Blue Raster also sponsored the Sustainable World Community Social on Tuesday night.

2022 Esri UC

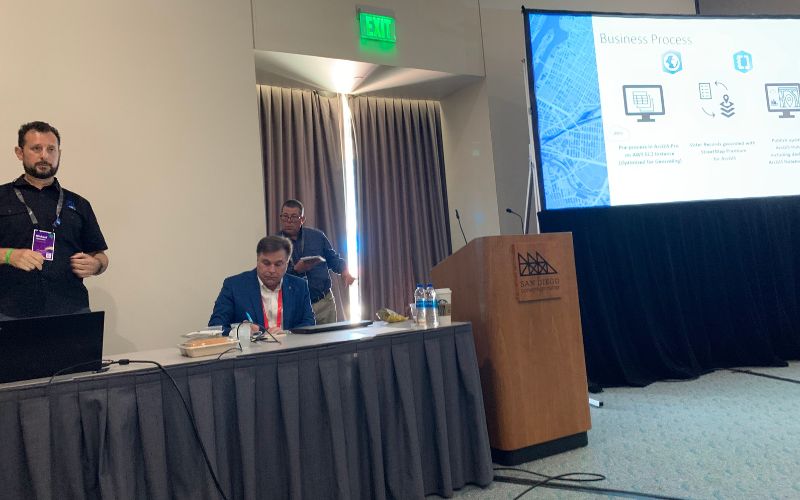
On Tuesday, Eric Ashcroft, Senior Project Manager, presented a lightning talk at the Sustainable World Spotlight Theater: Nonprofit Takeover to discuss Blue Raster Celebrating 20 Years of Supporting Non-Profits​. Blue Raster gave a spotlight to three of our projects: Jane Goodall Institute Tacare Program, World Resource Institute L.E.A.R.N. Tool, and Stimson Mekong Dam Monitor.

ArcGIS Velocity Session 

Our Manassas Park project was featured during the ArcGIS Velocity session. Suzanne Foss, Product Manager at Esri spoke with us one on one about our project which she featured in her presentation on Thursday. She highlighted how Blue Raster is using ArcGIS Velocity in our work. Andrew says it was rewarding to get the reassurance that our team’s work was functional and serving a good purpose, as well as that we are on the right path to develop it further as Velocity develops. This session also demonstrated the capabilities of ArcGIS Velocity and Real Time that we are eager to explore and implement in our work, whether it is for real time data or something like social media data scraping. 

UC Elections SIG

Elections Special Interest Group 


Michael Lippmann presented our work with the Georgia Secretary of State, Election Division on the development of the Redistricting Quality Assurance Tool that enabled Georgia to validate and confirm voting district assignments in 159 counties. In addition, we learned more about what tools are available to deploy through ArcGIS Elections Solutions for the upcoming elections.

Map Gallery

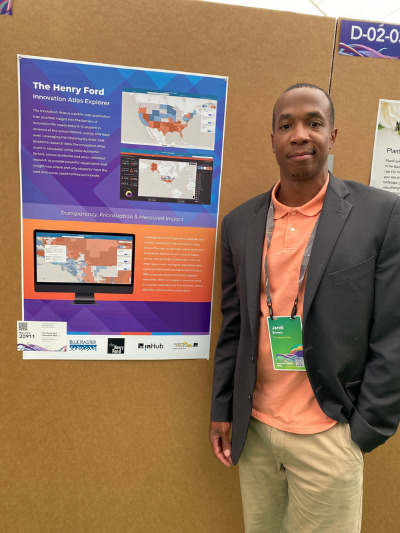
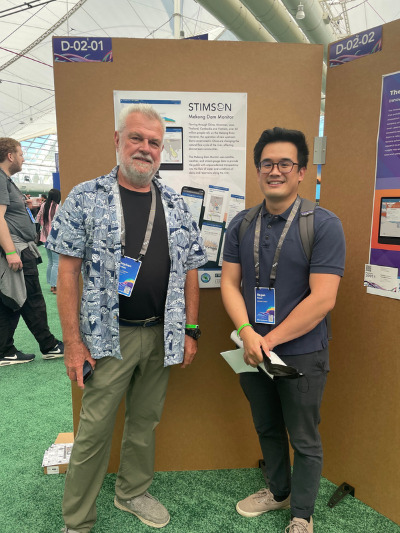
Blue Raster also had the opportunity to showcase four posters designed by our team members in the Map Gallery. We highlighted our work with The Henry Ford, Virginia Department of Transportation, New York Botanical Gardens, and The Stimson Center. We were thrilled to have to opportunity to meet with Jarell Brown from the Henry Ford and Regan Kwan from the Stimson Center at the gallery.

Mary Bracho, GIS analyst, says it was awesome to be recognized by our clients at the Map Expo, and it was interesting to visit client’s presentations. It was Mary’s first Esri UC experience.

“It was very exciting and amazing to be in a room of 15,000 GIS users, it’s not every day that you encounter this environment.” 

Mary also visited several demo theater sessions. As Blue Raster is getting into working more with Esri's ArcGIS Parcel Fabric, Mary had a meeting with the Esri Team and attended demo sessions. These sessions with the product team gave Mary lot of ideas and tools to implement in our own workflows. Mary also got the chance to meet with the ArcGIS Hub team and got to share some of the functionality GIS analysts would love to see from Hub.  

It was incredible to see all our partners, peers, and clients, and it was rewarding for us to see how Blue Raster was welcomed and recognized by our peers and clients as well.  

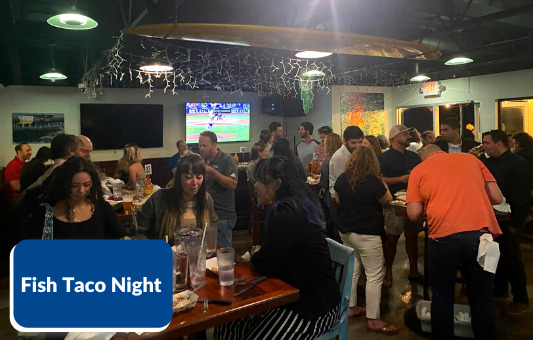
Thank you to all those that stopped by our booth, presentations, or our Fish Taco night. We hope to hear from you soon!

Contact Us

Let's get your GIS projects started!

Celebrating 60 Years of Discovery with Jane Goodall

DISCOVERY, INNOVATION & HOPE

On July 14th, 1960, a young Jane Goodall would arrive in Gombe, Tanzania to begin her study of wild chimpanzees. Six decades later, the same Dr. Goodall is a forerunner in the field of animal behavior, an innovator in community-led conservation, and a scientist whose work will continue to influence future generations of researchers.

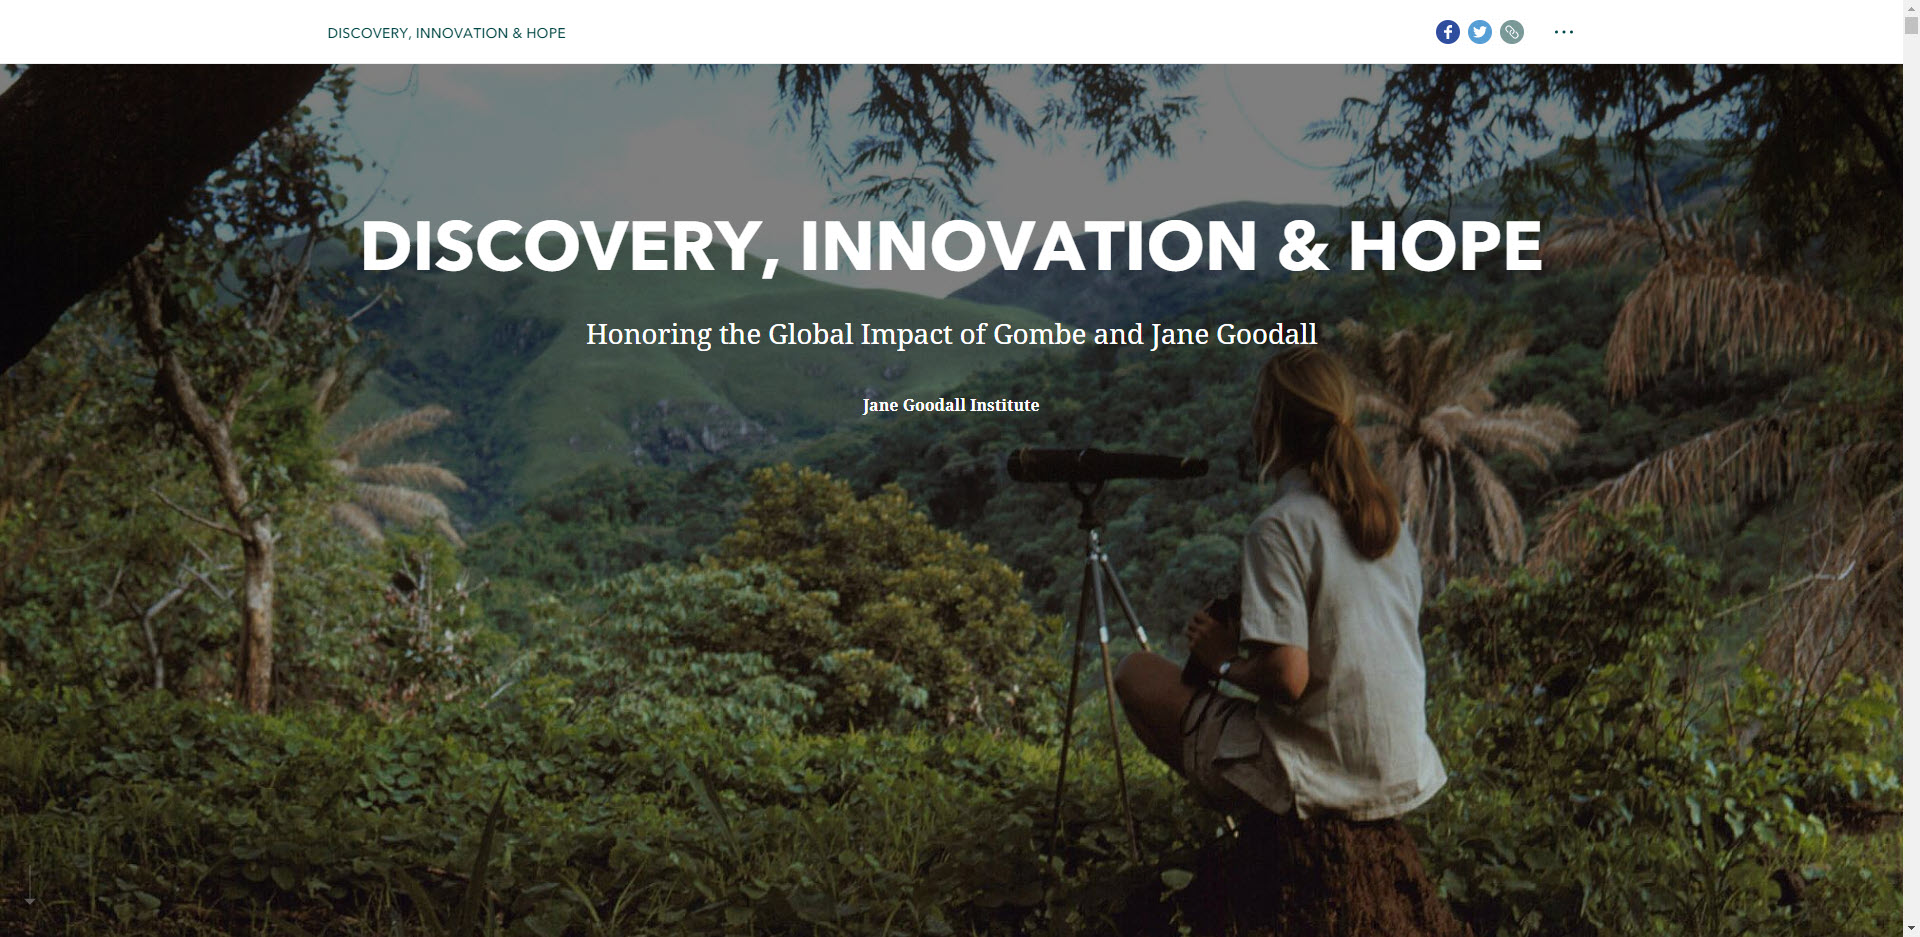
To celebrate the 60th anniversary of Dr. Goodall's pioneering research, Blue Raster partnered with the Jane Goodall Institute to create a new, interactive story map using Esri's ArcGIS StoryMaps technology. This new story map, titled DISCOVERY, INNOVATION & HOPE, builds on the previously published ENGAGE – LISTEN – UNDERSTAND – ACT, with a greater focus on how Jane’s work changed the world of conservation.

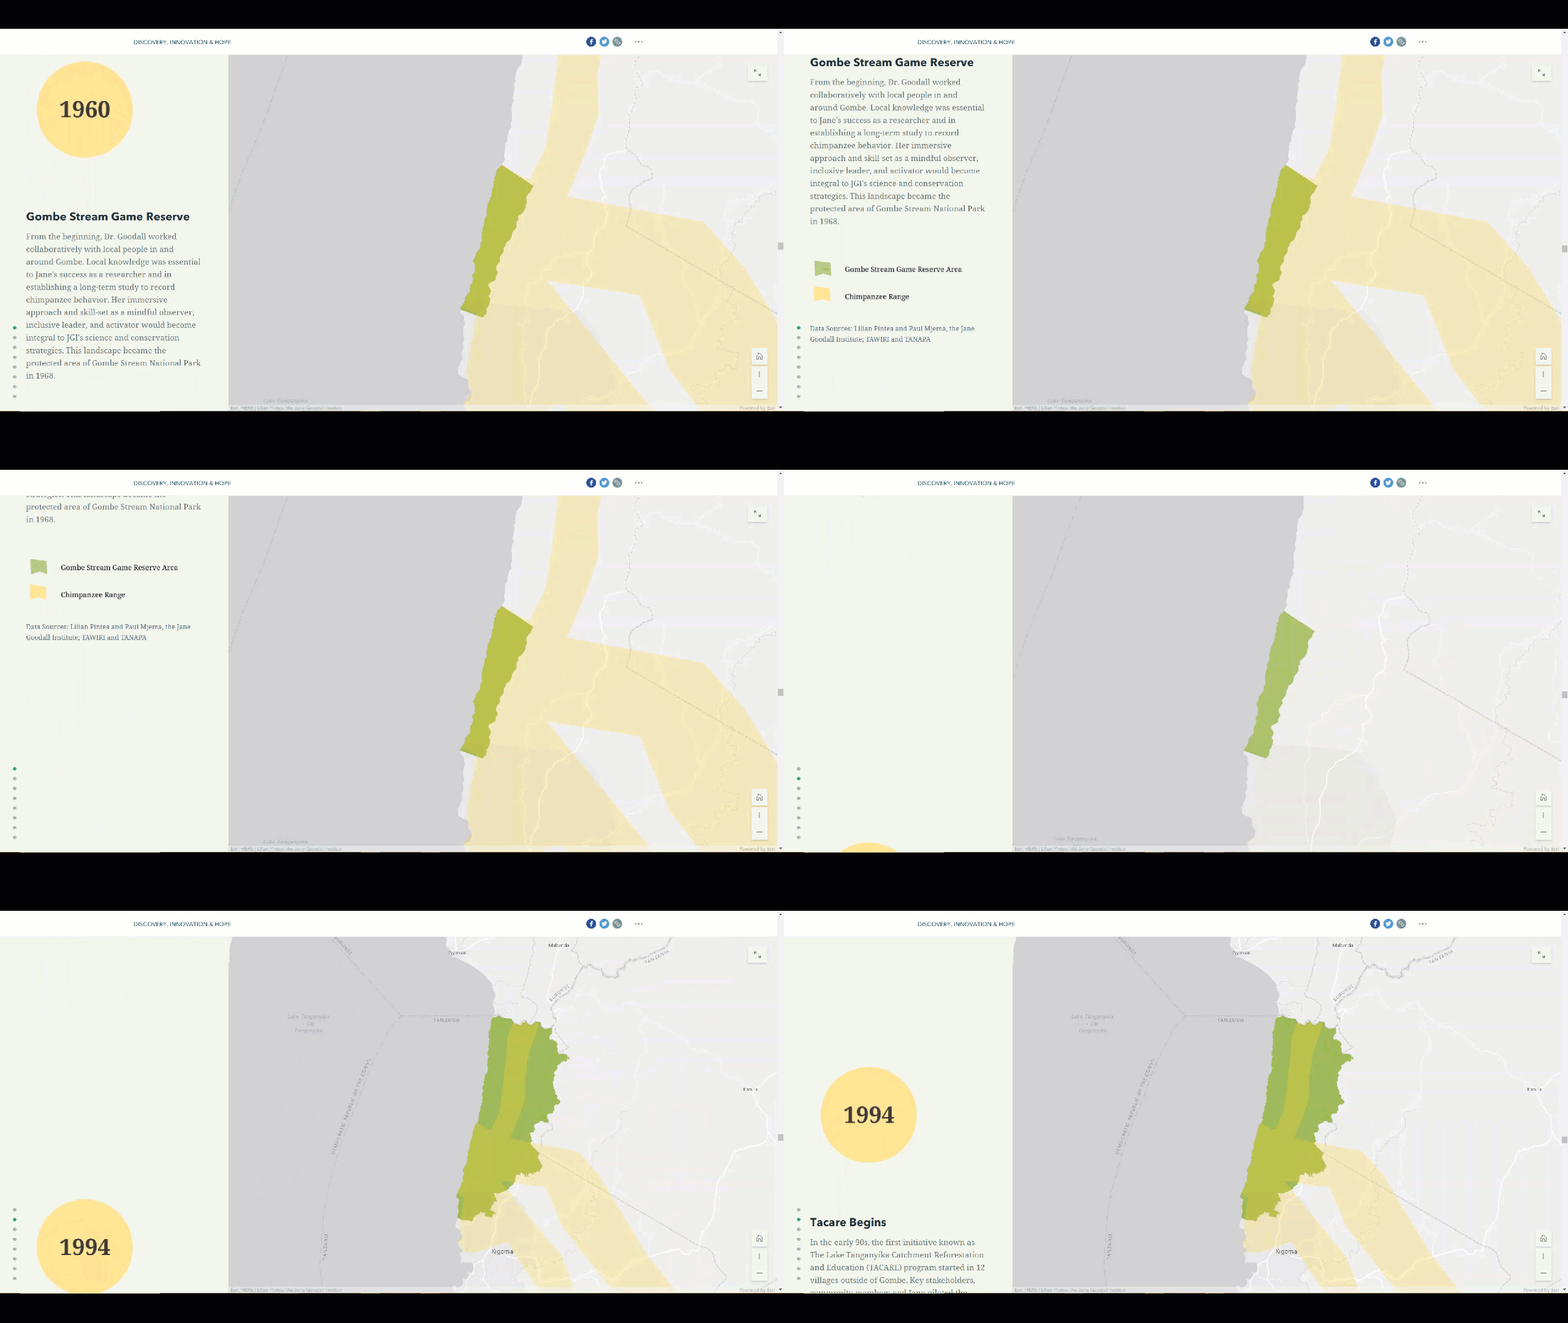
DISCOVERY, INNOVATION & HOPE utilizes the sidecar feature within ArcGIS StoryMaps to demonstrate how the Jane Goodall Institute’s research area has expanded over the past 60 years. Viewers can travel from the Gombe Stream Game Reserve of 1960 to the over six million hectares of land the Institute now works with today by simply scrolling through the maps.

Jane Goodall Institute Story map

Jane Goodall's Influence

A reoccurring theme throughout the Story Map is Jane’s dedication to mentorship. The knowledge and impact of Gombe researchers extends across the globe with over 300 scientific articles produced at the Jane Goodall Institute. An interactive map of affiliated researchers allows readers of the Story Map to learn a little more about the people who continue to study animal behavior in Tanzania.

Jane Goodall Institute Story map
Images courtesy of Vanne Goodall, Nick Riley Photography, Shawn Sweeney, Lilian Pintea, and the Jane Goodall Institute.

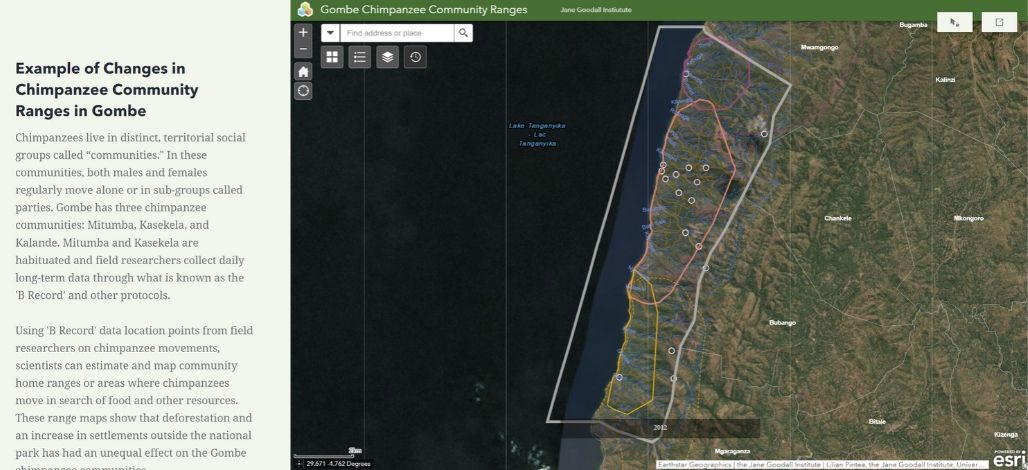
The importance of spatial analysis in conservation efforts is also highlighted. Gombe has three distinct communities of chimpanzees: Mitumba, Kasekela, and Kalande. Using long-term data, researchers were able to estimate range maps for the groups, which then informed decisions on habitat restoration. Web AppBuilder for ArcGIS brings these range maps to life by showing chimpanzee community movement from 1973 to 2016. Story map readers can interact with the app to learn about how deforestation and an increase in human settlements have affected each of the chimpanzee groups.

Jane Goodall Institute Story map

Restoration of vital great ape habitats is jointly achieved through natural resource management and local involvement in land-use planning. Connecting spatial information with conservation efforts fosters a more sustainable environments for both humans and chimpanzees.

View the new story map here. For more information about our work with the Jane Goodall Institute, read our blog posts here.

Highlighting Jane Goodall’s Conservation Approach with a New Story Map

ENGAGE - LISTEN - UNDERSTAND - ACT

Timed to coincide with Dr. Jane Goodall’s plenary speech at the 2019 Esri User Conference in San Diego, California, Blue Raster, Esri and the Jane Goodall Institute teamed up on an exciting new Story Map.

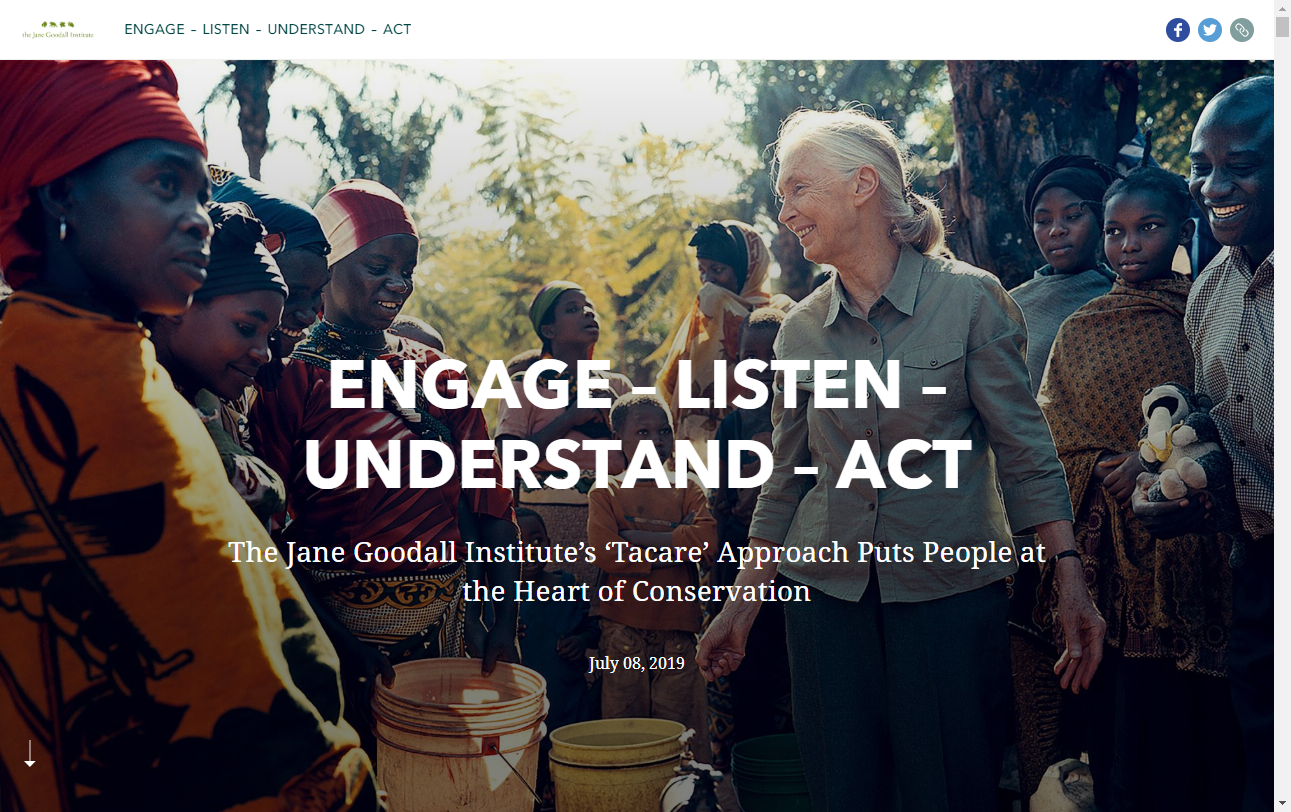
ENGAGE – LISTEN – UNDERSTAND – ACT, built with the brand new ArcGIS StoryMaps template, tells the story behind the ‘Tacare’ approach toward conservation. The story map outlines concerns over chimpanzee populations and the environment, the steps in the process of Tacare, and success stories with this conservation approach.

Beginning with an overview of how Jane Goodall first became involved with conservation through her work with chimpanzees, the story unfolds as Jane noticed that much of the forests in Western Tanzania, home to her beloved chimpanzees, had become barren hillsides after years of farming and other human related activities in the area. She realized that the only way to conserve chimpanzees and their habitat was to work directly with local people and communities. The story map we created titled, Engage - Listen - Understand - Act, explains this holistic approach and some of the successes the area has already seen through the work of Tacare.

Blue Raster is honored to have had the opportunity to help create the first dedicated web presence that details the Jane Goodall Institute's Tacare conservation approach and is especially thrilled to have been able to use the latest version of the next-gen StoryMaps builder.

An all-star team, including master storyteller Allen Carroll from Esri and Lilian Pintea, VP of Conservation Science at the Jane Goodall Institute, worked in collaboration with Blue Raster to produce ENGAGE – LISTEN – UNDERSTAND – ACT.

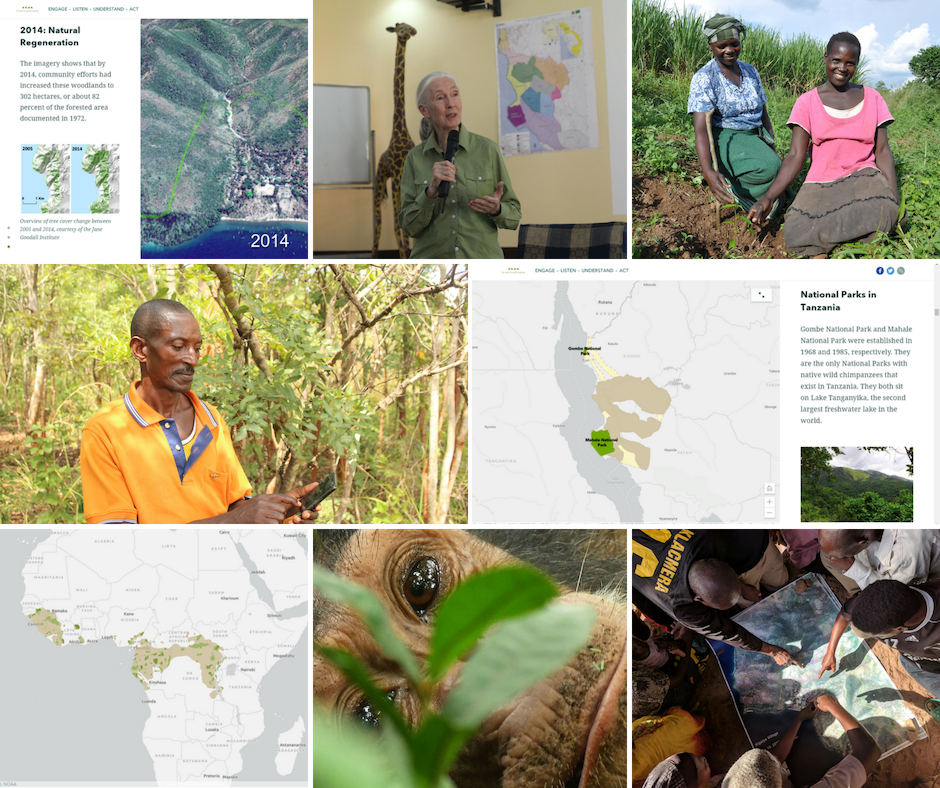
The new Story Map builder helps the reader flow seamlessly through the story of Tacare; the application intersperses captivating photos taken on the ground in Tanzania and interactive mapping elements that display chimpanzee ranges across Western Tanzania and the African continent. Success with Tacare can be seen in "before" and "after" aerial imagery, which helps readers to visualize the reforestation occurring in the area.

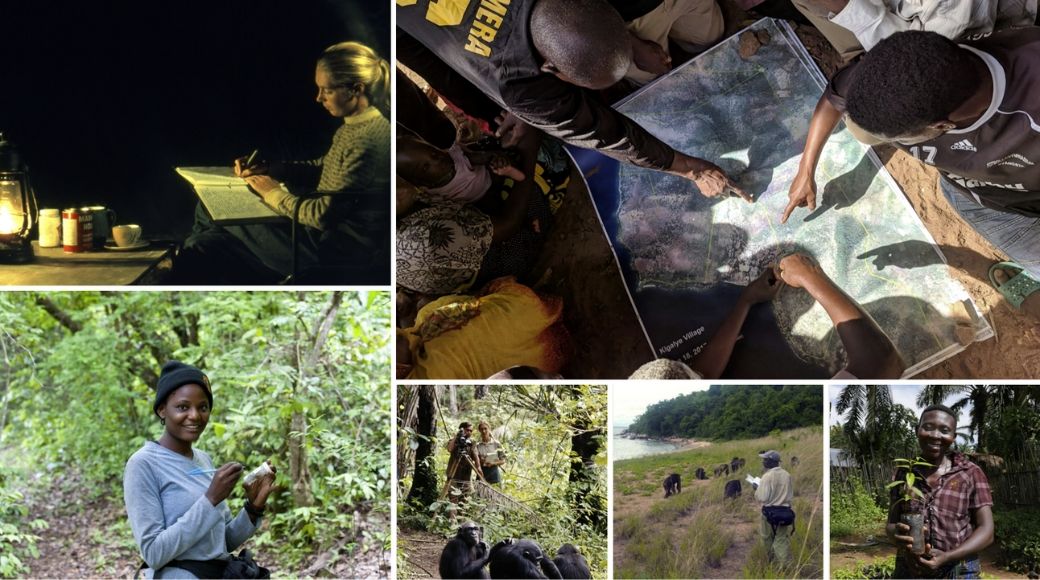
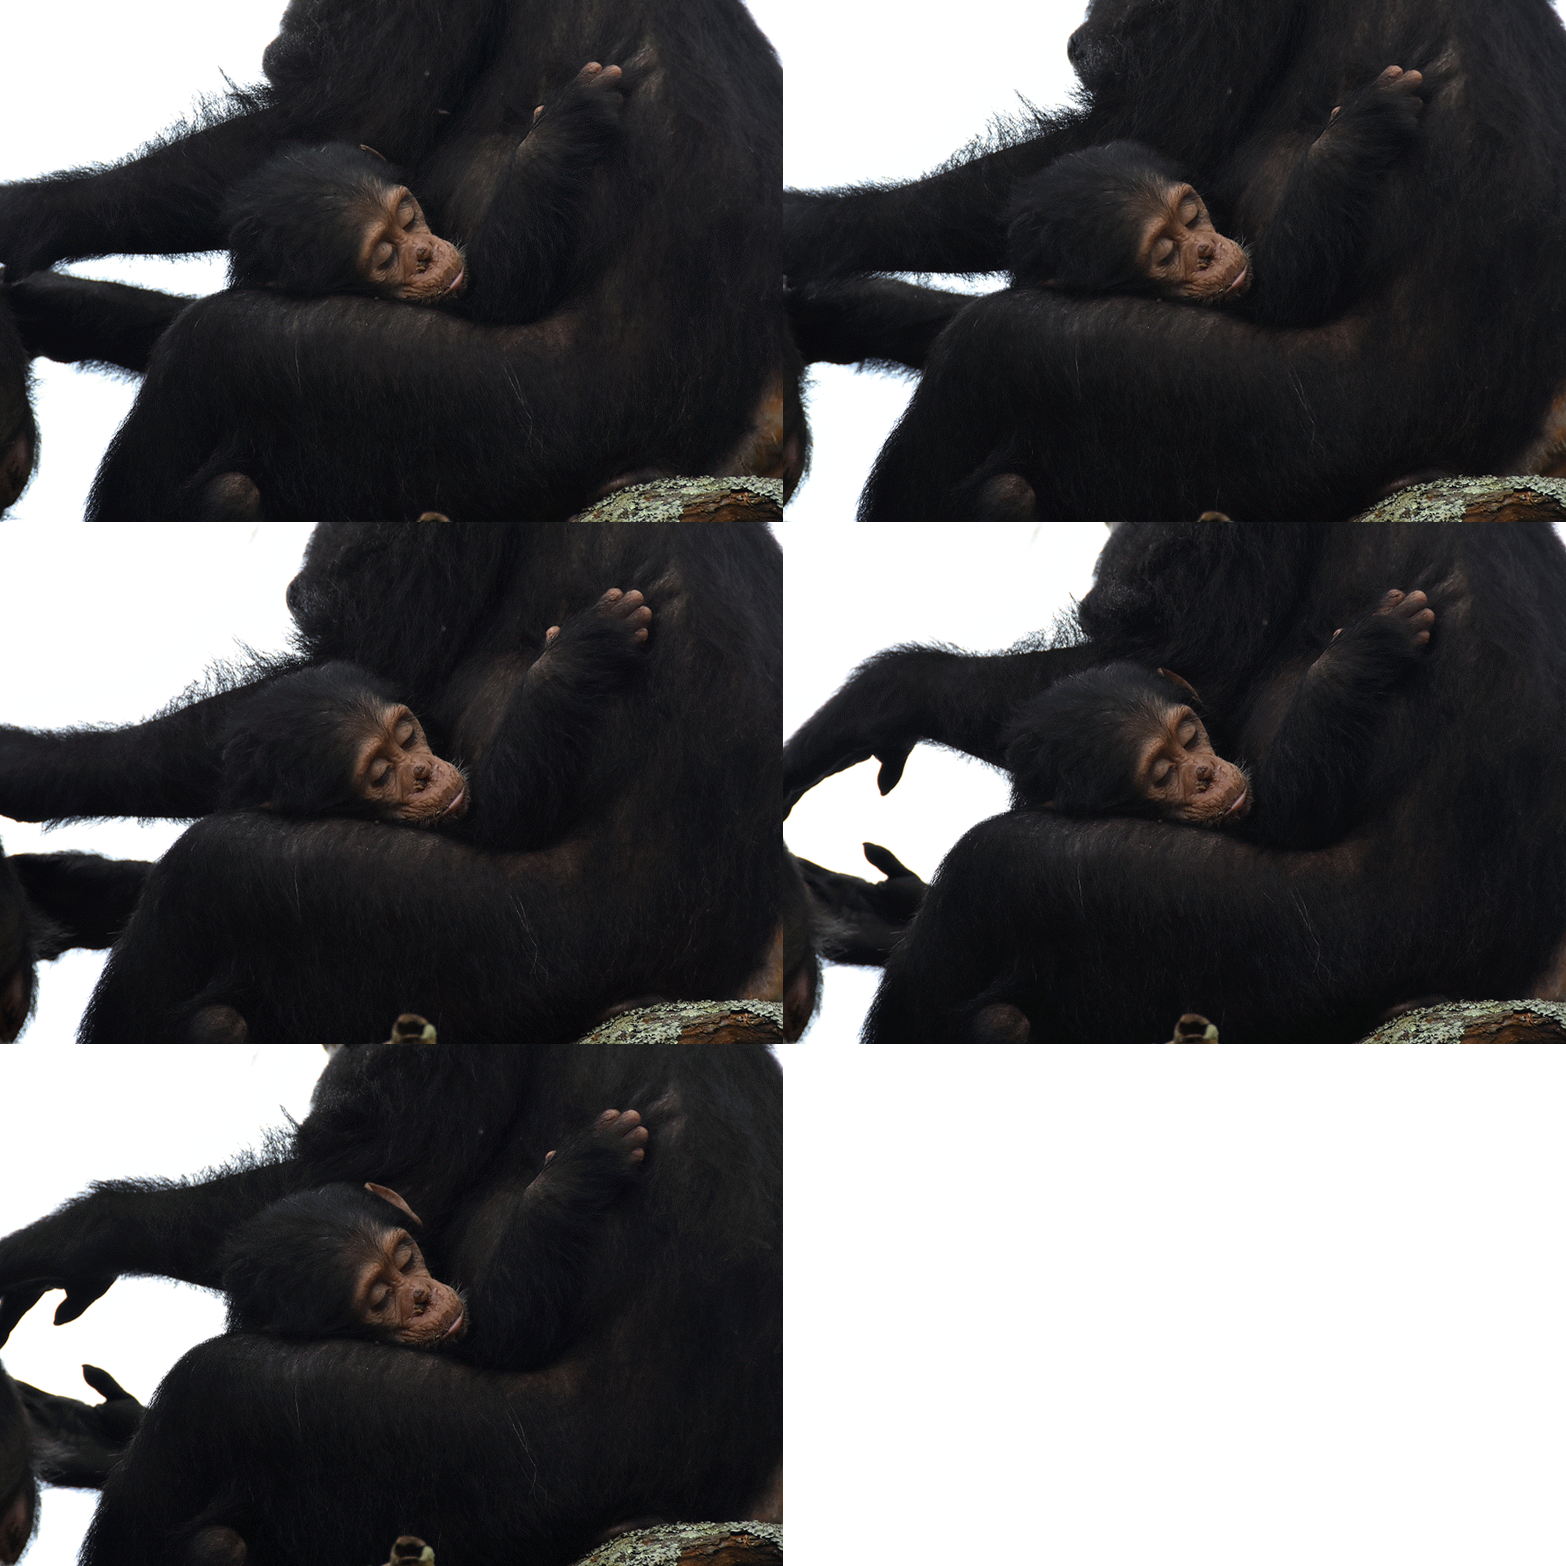
Jane Goodall photos

Not only does this story map detail the incredible conservation efforts led by the Jane Goodall Institute but it also serves as a call-to-action for other conservation efforts and organizations around the world. Conservation is in the hands of local people - by understanding the needs of local communities, we are then able to help create a sustainable future for our world.

BR_JGI

This story map will be displayed at the Esri UC Conference. If you're attending, make sure to check out Blue Raster's booth!

For more info about our work with the Jane Goodall Institute, read our blog post about our dashboard project in Tanzania.

Data to Decisions with the Jane Goodall Institute

Working from the inside out, the Jane Goodall Institute (JGI) has notoriously worked for decades to protect the lives of Chimpanzees and other extraordinary wildlife throughout Africa. Blue Raster was elated to get the opportunity to work with JGI to create the Western Tanzania Forest Monitoring Dashboard, connecting communities and data to manage forests and habitats in Tanzania.

"There's no way we can even attempt to save these precious Gombe chimpanzees unless we could improve the lives of the people living around that last little oasis of forest."

-Jane Goodall

Wildlife throughout Africa are depleting due to loss of habitats, illegal poaching, disease, and illegal pet trade, but the Chimpanzees have been hit with some of the most dramatic losses in the last hundred years. Since 1994, the Jane Goodall Institute has focused on Community Centered Conservation, encouraging villages to participate in land use planning. The Forest Monitoring Dashboard was designed to use information collected by locals, evaluate if the monitoring efforts were effective and provide alerts immediately for action.

To create this application, Blue Raster worked with the Open Data Kit (ODK), which JGI has been using since 2010 for on-the-ground GPS Data collection. Locations of Sawmills, Wildlife Traps, and bullet cartridges are just some of things that monitors are looking for to alert Village Government and Park Chiefs of illegal activity.

Using ArcGIS Online, we began to create data services for use in the Dashboard. From the GPS Points came Patrol Paths, and from Patrol Paths came Village Participation. Within the Dashboard, each village can see how their monitoring effort relates to the surrounding communities, as well as determine the variety of threats and wildlife encountered, and explore images taken from each location.

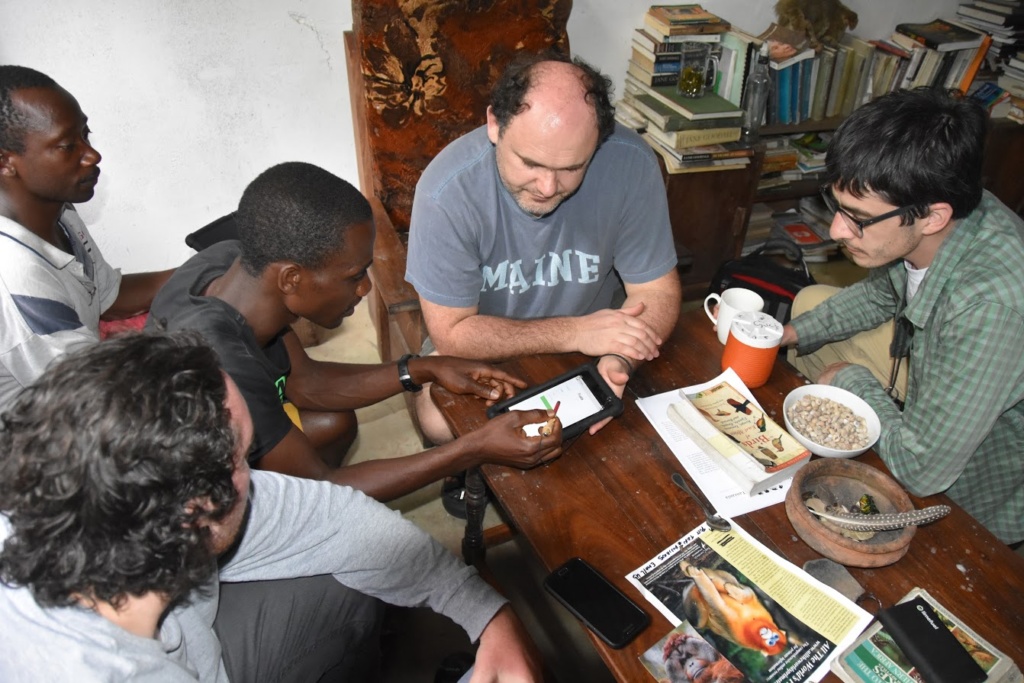
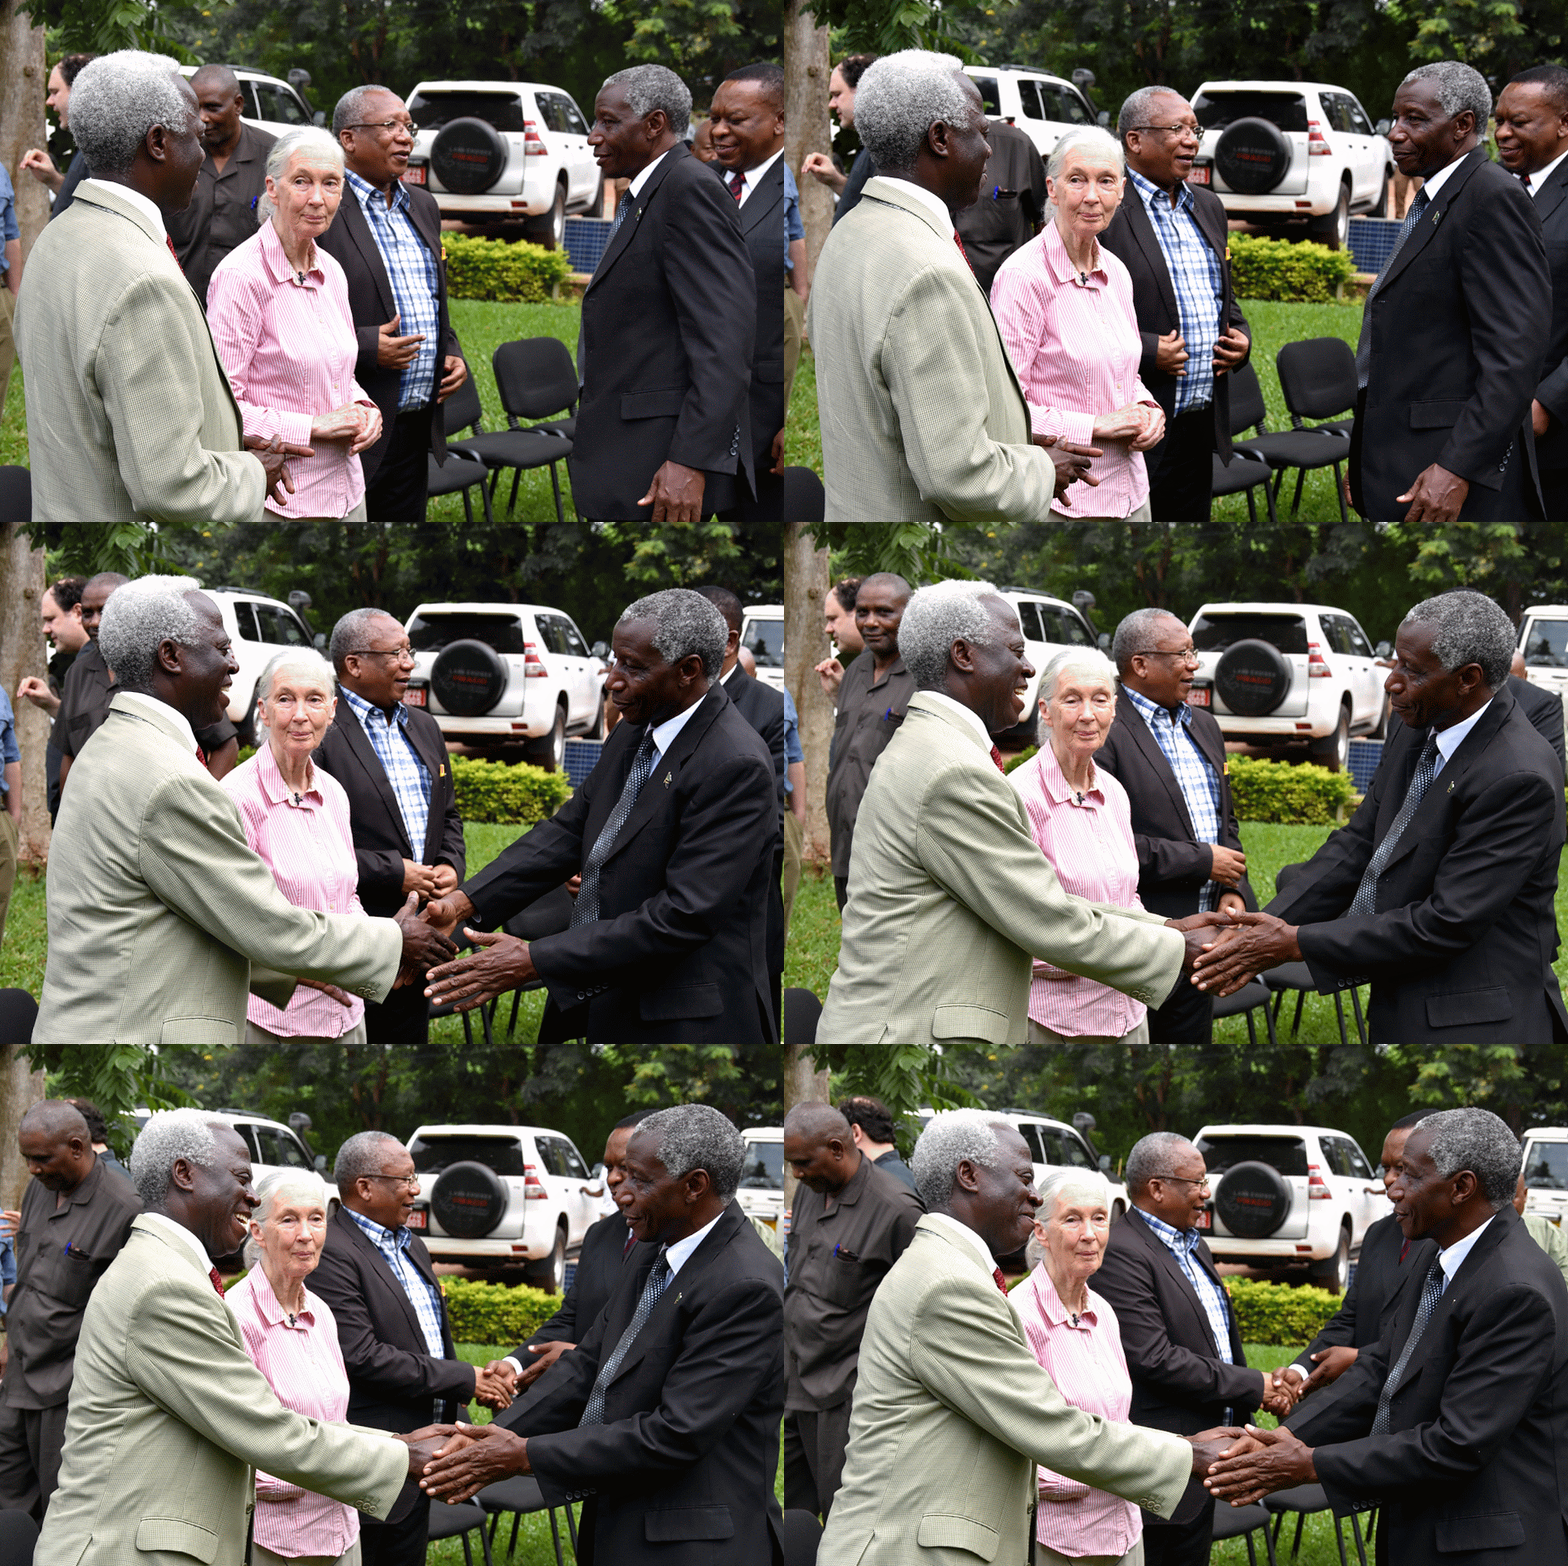
After the completion of the Dashboard, Blue Raster traveled to Kigoma, Tanzania to present with Dr. Jane Goodall to the Regional Commissioners from Kigoma and Katavi regions. We worked with them one-on-one to understand the technology, how it could benefit them, and ways which it could be improved. This trip was one of the farthest from home, and one of the most rewarding. We then had to ask ourselves, what's next for protecting these animals? Can we use Survey 123 for seamless integration with the Esri GIS Suite? What about the use of Drones to detect forest threats? Our work continues.


Page 1 of 2