Development

New Release: APTA Industry Footprint

Following the successful launch of American Public Transportation Association’s (APTA) Industry Footprint, Blue Raster has delivered Version 2. The web application provides users with a comprehensive understanding of the role of public transportation in their communities and throughout the United States. Given that public transportation provides essential mobility to people throughout the country, reduces congestion in crowded cities, and improves air quality, APTA hopes to encourage people to opt for it more often and fight for continued support and funding from state and federal legislators.

The latest version of Industry Footprint includes helpful new features:

  • Addition of bus and rail manufacturers to the map
  • Addition of state legislative upper and lower chambers to the map
  • Updated user interface

Now everyone can view APTA’s Transportation Industry Footprint to get key facts and statistics about where public transportation is available and how it’s being used in their state legislative and congressional district boundaries.

Blue Raster built upon the first version of the tool by integrating the Sunlight Foundation’s Open States API for up-to-date details on state legislators and state legislative districts. The transit information is obtained from TransitFeeds, which offers an extensive archive of standardized transit lines and schedules.
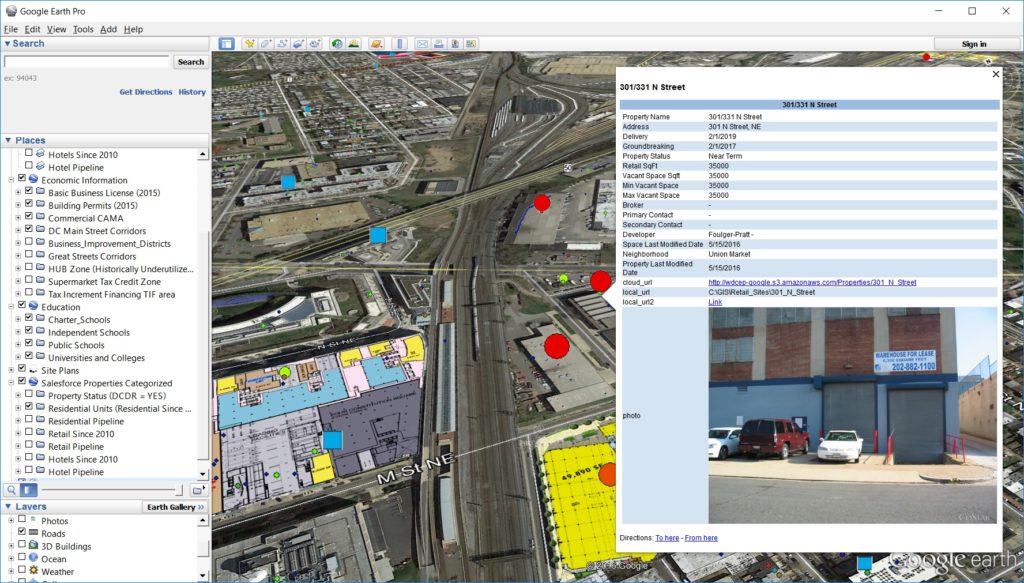
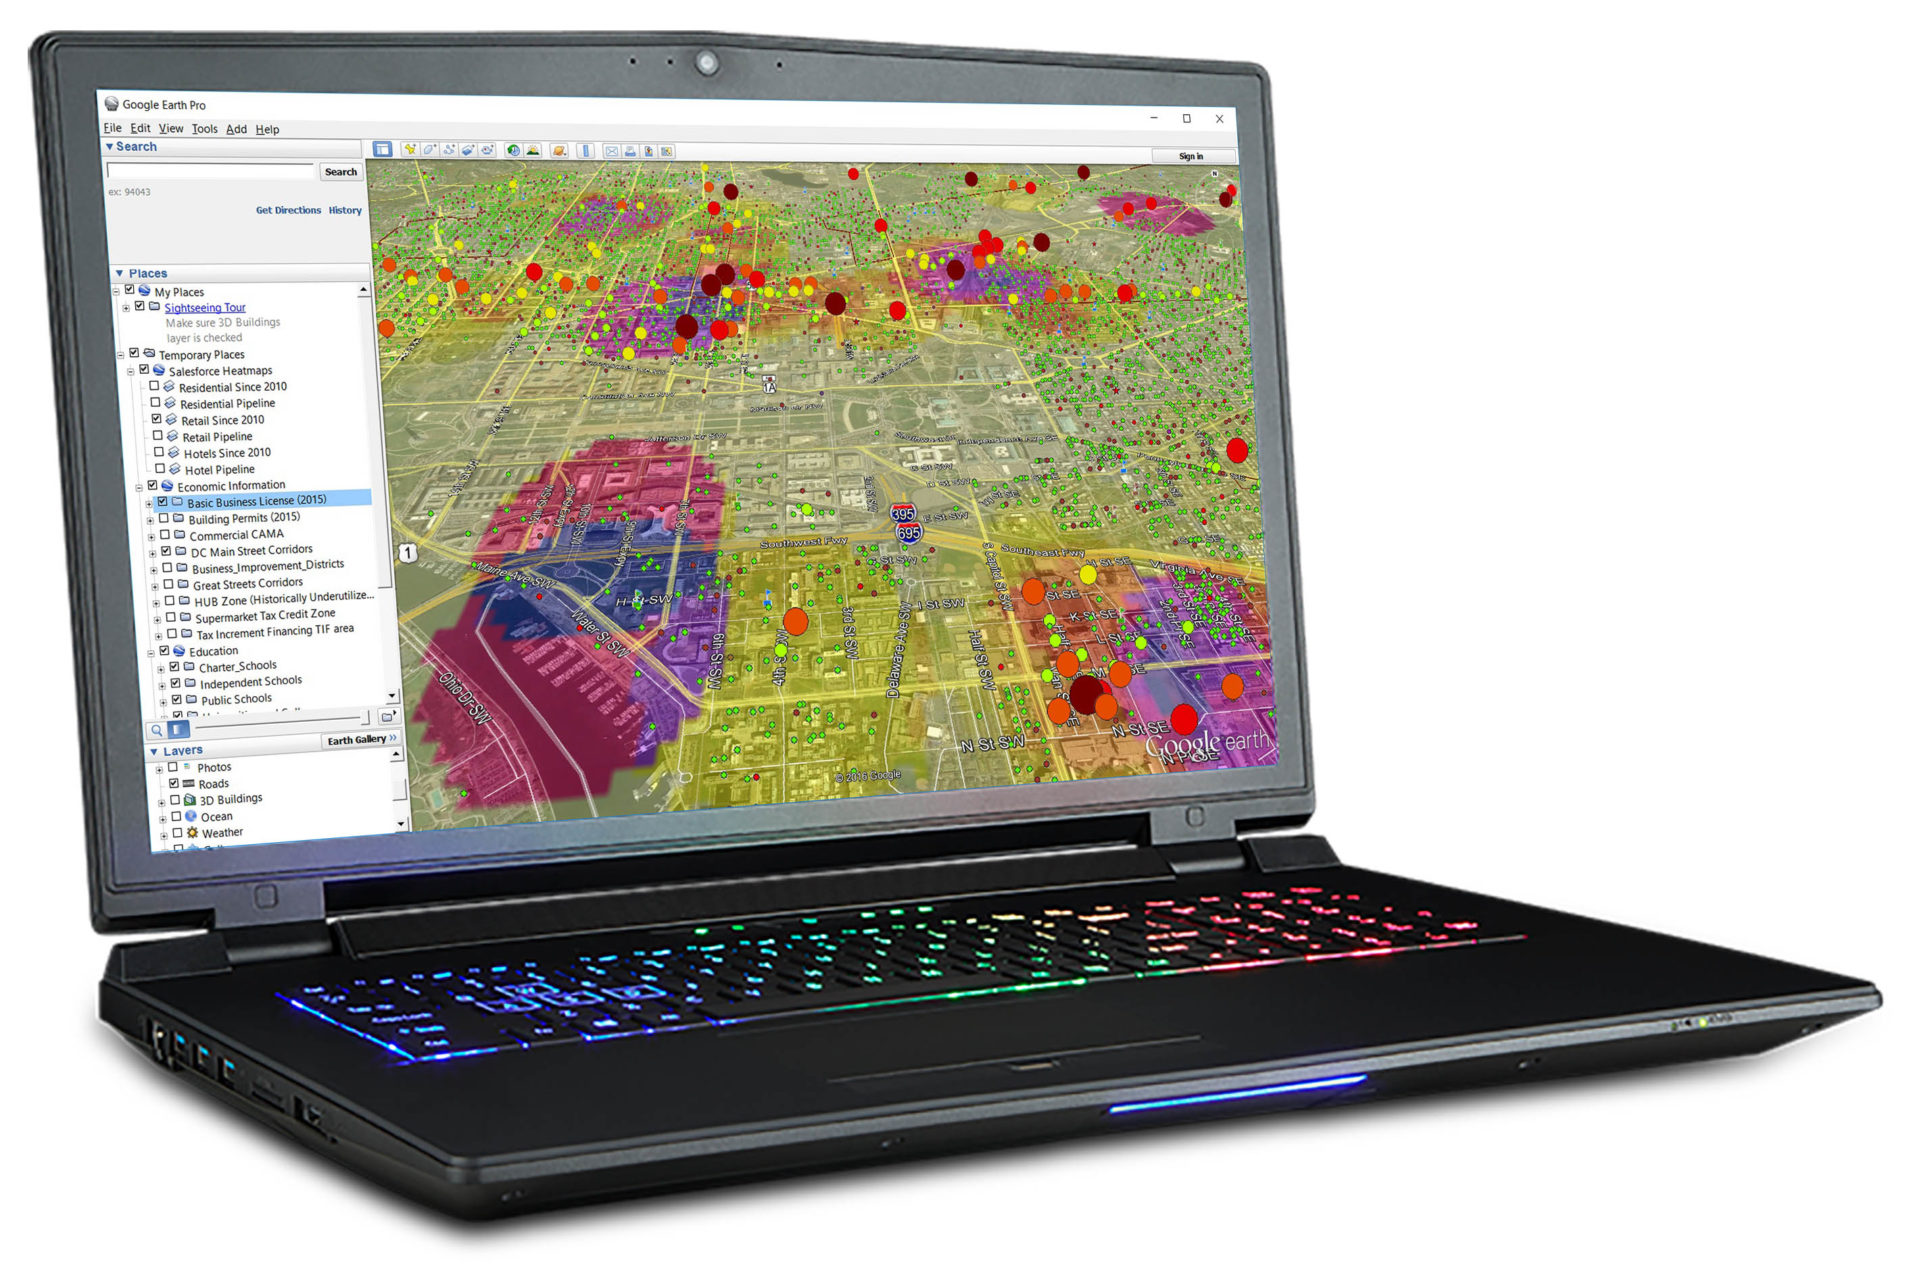
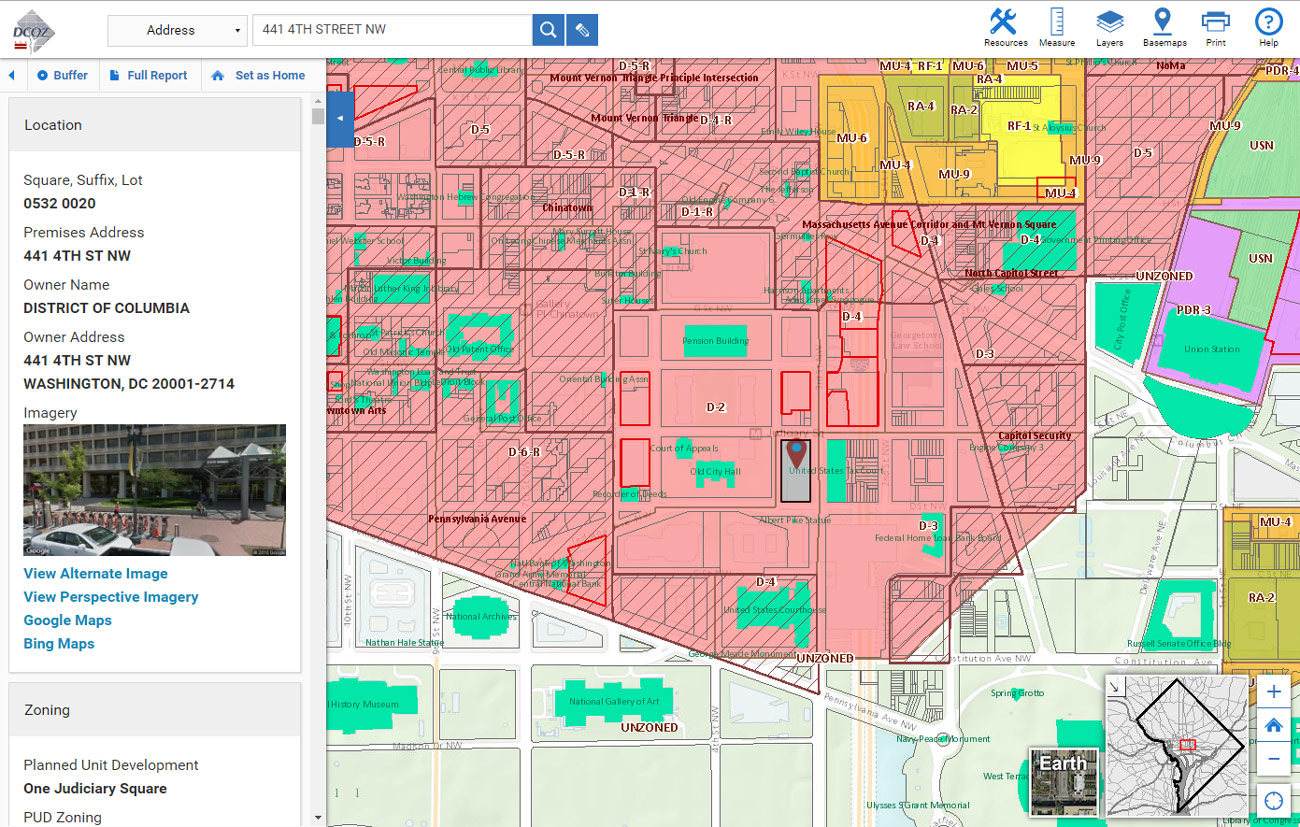
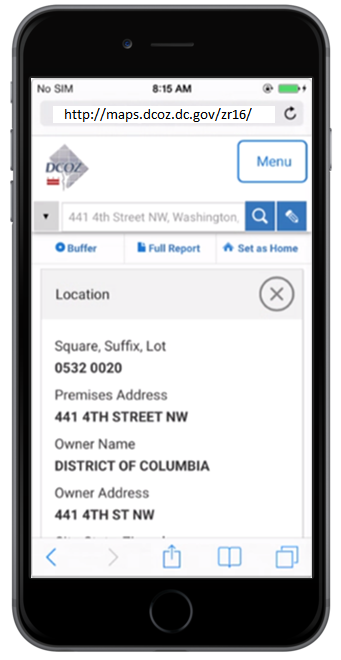
Historic Zoning in DC

Blue Raster worked with the DC Office of Zoning (DCOZ) to compile scanned versions of the 1958 zoning data as it evolved over approximately 60 years to present day. The data was georeferenced and converted to digital services and then displayed through an interactive application that allows users to choose a year of interest and see which case records happened on or before that year. By investigating the evolution of the zoning information for a property, insight can be gained into the when and why a change occurred.

By using a responsive design, the information is now available across a number of devices and browsers. Be sure to explore the history of your zone today!

DCOZ Historic Zoning Viewer


Cultivating Business Centers by Harvesting Data

The Washington D.C. Economic Partnership (WDCEP) attracts new organizations to the D.C. area by assessing the needs of potential businesses, and then matching those needs to suitable locations within the city. WDCEP then demonstrates site suitability by presenting demographics, neighboring businesses, economic trends, pending constructions and space availability. To organize and present all of this data, Blue Raster transformed WDCEP’s retail and construction data into maps and visualizations, and combined it with DC GIS Open Data. Using the Google Earth platform, this information paints a compelling picture of where and why businesses will flourish in D.C.

Screenshot1

With Blue Raster’s help, WDCEP can now provide insightful, layered stories on demand, leading to informed decisions by potential businesses considering a move to the D.C. area.


pic_cshuskey-225x300WDCEP’s core mission is to actively position, promote, and facilitate economic development and business opportunities in Washington, DC.   Blue Raster helped us build a platform that gave us fast access to current data and simplified the telling of DC’s story to local, national and international audiences.

– Chad Shuskey, Senior Vice President of Research and Real Estate, Washington DC Economic Partnership


Blue Raster at Esri UC, June 27–July 1

Blue Raster is proud to attend our 16th Esri User Conference in San Diego! This year we have teamed up with the National Arbor Day Foundation to replant our national forests. Place a pin on our map at #EsriUC, and we will plant a tree in Tahoe National Forest. Be sure to come check out Blue Raster at booth 2215, near the Sustainable World Showcase! Meet the Blue Raster team, learn about our mapping applications, plant a tree in Tahoe National Forest, and more!

Blue Raster events at Esri User Conference:

Monday
    • Impact of Climate Change on Children (UNICEF)
      Monday (6/27) 4:30pm, Christopher Gabris
      SDCC, Ballroom 20 D – Lightning Talk
    • Visit us in the Map Gallery to see our UNICEF poster
      Monday (6/27) 3:30pm– 7:00pm, Map Gallery Opening and Evening Reception
      SDCC, Sails Pavilion
Tuesday (World Resources Institute)
    •  Using Big Data to Identify Patterns of Deforestation and Drive Action to Protect Forests (World Resources Institute)
      Tuesday (6/28) 2:30pm, Liz Goldman
      Conservation Tower
    • Mapping Sustainable Development Goals (DHS Program), Tuesday (6/28) 3:00pm, Christina Phang, Sustainable Development Tower (Exhibit Hall B1)
    • Community Forest Monitoring (Jane Goodall Institute)
      Tuesday (6/28) 3:15pm
      SDCC, Ballroom 24 C
    • Fish Taco Night in Ocean Beach
      Tuesday (6/28) 7:00pm – Blue Raster’s annual retreat to Ocean Beach for the best fish tacos – Stop by the booth for details
Wednesday
  • Small Business Partners Walk through
    Wednesday (7/29) 1:30pm
  • Panel Presentation – Effective Geospatial Tools for Sustainable Development
    Wednesday (6/29) 3:15pm, Adrienne Allegretti Room 30A

Before you arrive, check out esri.com/events/user-conference/agenda  for a complete schedule of events.

We look forward to seeing everyone and all of the latest mapping trends and technologies, stop by our booth and say hello!

Untitled-7c

Zoning Washington D.C.’s Future

Blue Raster and the DC Office of Zoning (DCOZ) worked together to create the DC Zoning Map of 2016, a mobile-responsive application that incorporates recently adopted DC Zoning Regulations of 2016 in a platform available to the public. The application provides users a rich representation of DC Zoning by color and offers powerful search capabilities, detailed PDF reports for properties, and high quality cartographic outputs. It delivers all the new regulations and maps to consumers accessing the web via a growing variety mobile devices and platforms, and was nominated by Technical.ly for Best Web/Mobile Product of the Year in the inaugural D.C. Innovation Awards.

The launch follows the first major rewrite of Washington D.C. Zoning Regulations since 1958. The modern application allows ease of access for the public who may be curious about their neighborhood’s potential development or proximity to historic sites, while being a valuable resource to residents, developers, and government agencies who want to keep Washington growing and lively while respecting the historic character of the city.

The DC Zoning Application leverages the latest technologies to provide these advanced features to the user. For example, ArcGIS for Server delivers geographic data via map services, and React JS and Backbone JS drive the architecture and sustainability of the code base. The site fully integrates with the government’s existing systems, such as the Interactive Zoning Information System, delivering valuable lot-level data and reports. Customized geoprocessing and vector printing allow users to export stylized, high-quality cartographic maps, while PDFKit produces standardized pdf reports for each property of interest. Sweet Alerts deliver customized messaging throughout the application experience.

Explore Washington D.C. and visit the application today.


NyambiThe new ZR16 zoning map application and the Zoning Handbook generate a greater active interest in zoning by presenting visual data and a lot of content in a clear and concise manner. Blue Raster effectively worked to translate DCOZ’s vision into an application we are all proud of.

– Nyambi A. Nyambi, Chief Technology Officer, District of Columbia Office of Zoning


Page 5 of 5