Economic Development

Track Industrial Spaces in the Mekong Region with the Updated Mekong Infrastructure Tracker

The Mekong Policy Project aims to address the regional environmental and social impacts along the Mekong River to improve food security, stability and cross-country relations.

Launched earlier this year, The Stimson Center's Mekong Infrastructure Tracker offers unprecedented transparency into the financing and development of roads, rails, waterways, and power generation projects in the Mekong region. Funded by USAID and supported by The Asia Foundation, the tool allows users to search and filter for projects by type, operational status, funders, and more.

Mekong Infrastructure Tracker Updates

Now, with the latest release, the Tracker includes data on Industrial Spaces. In addition to major transportation hubs, such as railway stations, airports, and seaports, these include special economic zones, cross border economic zones, and industrial zones. These areas, with special tax treatment and other regulations, are key centers of economic activity and international investment.

mekong infrastructure tracker Industrial Spaces

"The Tracker's new industrial spaces dataset provides for the first time a visualization of 700+ completed and planned industrial zones, special economic zones, airports, train stations, and seaports in the Mekong region. We think the private sector, government stakeholders, and NGOs will find particular interest in viewing this data. When viewing the data on the Project Impact Screener, the connectivity of the region really come forward because these industrial spaces can be framed together with a comprehensive set of transportation routes and power generation assets."  -  Brian Eyler, Senior Fellow and Director at The Stimson Center

mekong infrastructure tracker Stimson Industrial Spaces 1

Leveraging ArcGIS Online and the ESRI JavaScript API, The Mekong Infrastructure Tracker builds on existing data to present a comprehensive source of information on energy, transportation, and water infrastructure in the Mekong countries. Additionally, there is an ArcGIS Survey123 link that allows users to submit more project data or provide updates to existing data.

The Mekong Infrastructure Tracker platform is the premier resource for researchers to track, monitor, and quantify the development of energy, transportation, and water infrastructure assets and the social, economic, and ecological changes they bring to South East Asia.

Clearview Analytics Tool: Accelerating Economic Insight

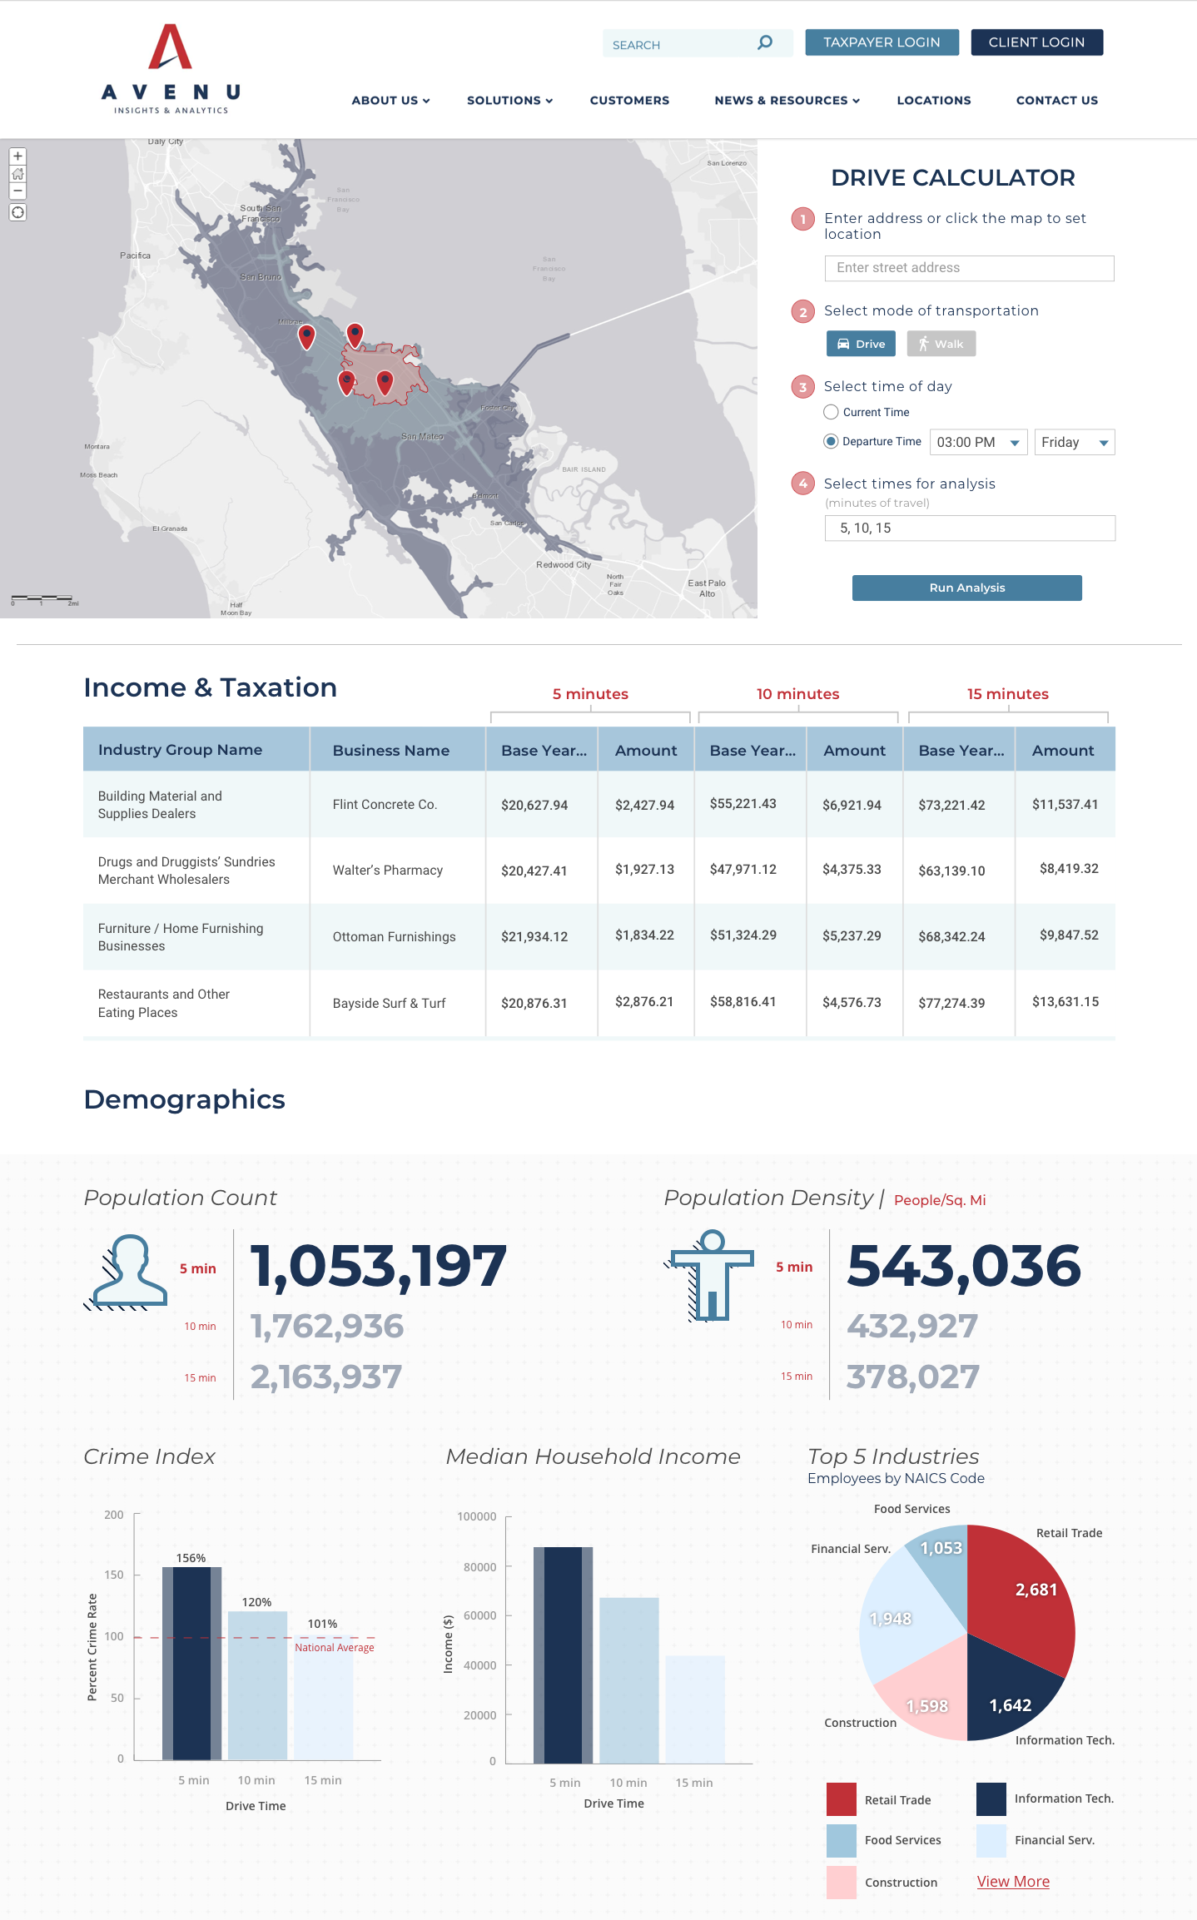
Avenu Insights, a company focused on improving and maintaining revenue streams for state and local governments, and Blue Raster have just released the first iteration of the Clearview Analytics Economic Development Insights (EDI) tool. The Economic Development tool provides key insights to cities and counties to attract new business, plan future investments, and understand the competitive landscape. The tool is completely interactive and allows users to enter, analyze, and export data for their unique area of interest.

Input an address or select a point on the map to create reports using drive time distances that visualized areas of economic influence and reach

Economic Insights

The new tool uses Avenu Insight's Property Tax and Commercial Sales Tax in combination with ArcGIS GeoEnrichment and Analysis capabilities for site-level analysis of tax revenue. Some of the features of this tool include:

  • Integration with key Demographic and Economic indicators from the ArcGIS GeoEnrichment API to assess market suitability
  • Drive-Time Analysis capabilities from ArcGIS Online to set market areas of interest
  • Up-to-date Property and Sales Tax Revenue data on a quarterly reporting basis, broken down by NAICS code at the individual property level

Providing cities and counties this analysis tool is critical in supporting the economic growth and future success within that landscape. With this tool, businesses and Governments can answer a variety of questions they might have:

"What is the current composition a specific area by business sector?" or "How much growth has retain seen in the central business district in the past few years?"


Econimic Insight tool

For a limited time, Avenu is offering a Free Trial of the Clearview EDI tool for your jurisdiction. Don't miss this opportunity to be a pioneer for this tool and provide feedback for future iterations.

Blue Raster worked closely with Avenu Insights to build out this tool through design, development, deployment using the latest Esri Enterprise 10.7.1, the ArcGIS API for JavaScript, and Esri's Geoenrichment API. In addition, our team worked with Avenu Insights to configure and maintain their ArcGIS Enterprise Server. Our team is excited to continue GIS analysis and capabilities which support healthy economies.

Want to learn more about GIS for Economic Insight?

Contact us today!

ArcGIS Urban: Take City Development Further

Blue Raster Project Manager Megan Gottfried took her ArcGIS Urban skills to the next level at Esri’s "Deploying ArcGIS Urban" training. The training, held in San Diego just before Esri’s annual User Conference, included other Esri business partners, distributors, and advanced level users from around the world.

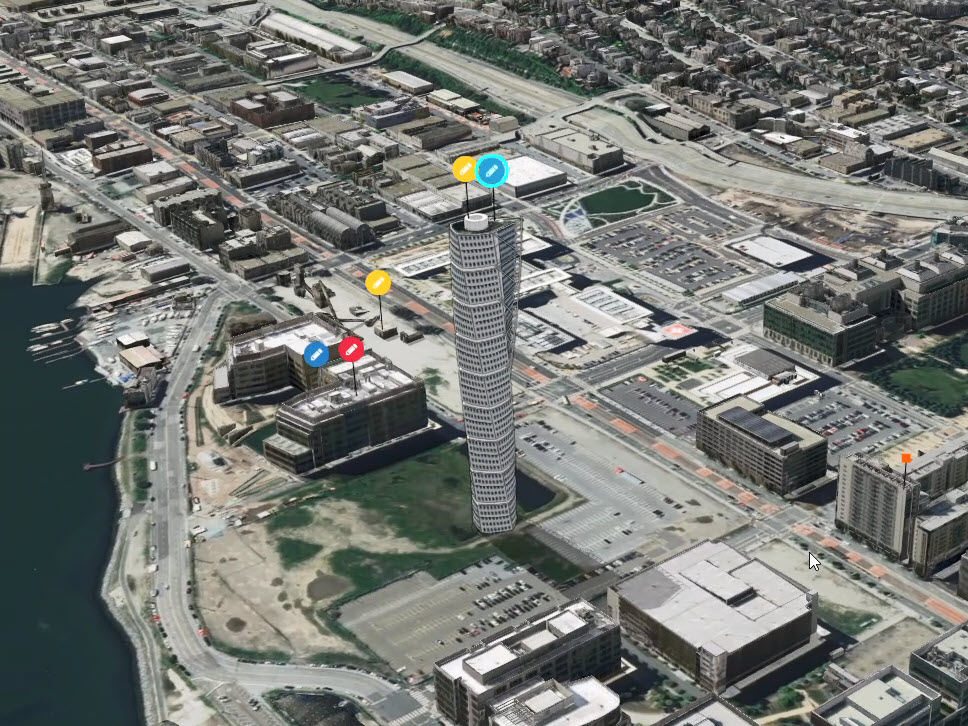
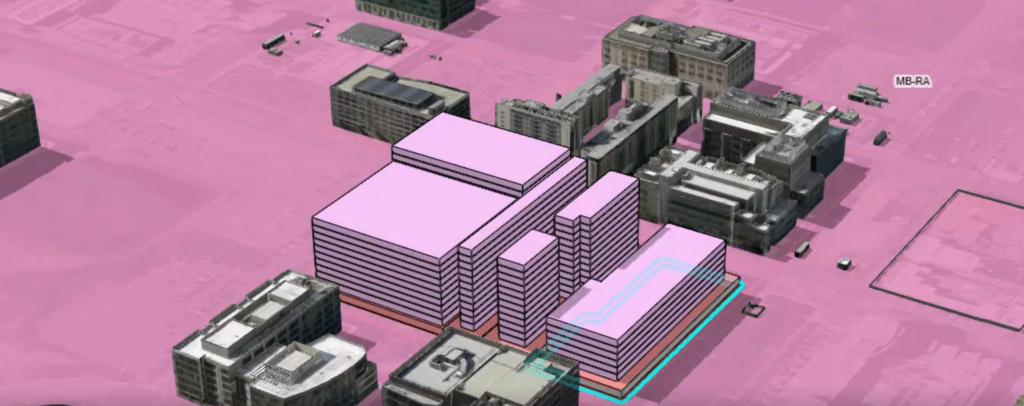
ArcGIS Urban is gaining significant attention in the GIS and City Planning & Development industries. The platform is a complete solution allowing municipal planning departments and development-focused NGOs to improve urban planning practices and decision-making on a city-wide scale. Users can use ArcGIS Urban to create 3D renderings of city landscapes, proposed buildings, and compare proposed site projects across key stakeholders.

ArcGIS Urban case study

Megan Gottfried used San Francisco as a study area for development and used ArcGIS Urban technology to assist the city’s urban planners with the growing issue of overcrowding. Key program features such as theoretical population and employment projections helped officials to understand the regional severity of the problem and work to find innovative solutions, while 3D building renderings with zoning and building setback details gave realistic building city scapes for user exploration.

San Francisco City
"Today's advanced GIS software can now model cities in 3D and integrate the full planning workflow, thereby dramatically enhancing efficiency and effectiveness."

- Scott Edmondson, Senior Strategic Sustainability Planner for the City of San Francisco

Other highlights of the training session included a product demo and an overview of the ArcGIS Urban system. in addition, Megan Gottfried was able to learn both the back-end and front-end ArcGIS Urban platform and provide clients with tips and best practices for deployment. Megan tested the many features of the ArcGIS Urban program and created sample projects & planning files for the San Francisco area. The event concluded with a Q&A session where Megan and her colleagues were able to ask questions about the program and troubleshoot some of their problems.

ArcGIS Urban Site Project

Learn More

Blue Raster is excited to begin offering ArcGIS Urban solutions for our clients. Are you interested in harnessing the power of informed planning for your business or municipality? Contact us today!

Contact Us

  • This field is for validation purposes and should be left unchanged.

3D Zoning in Washington D.C.

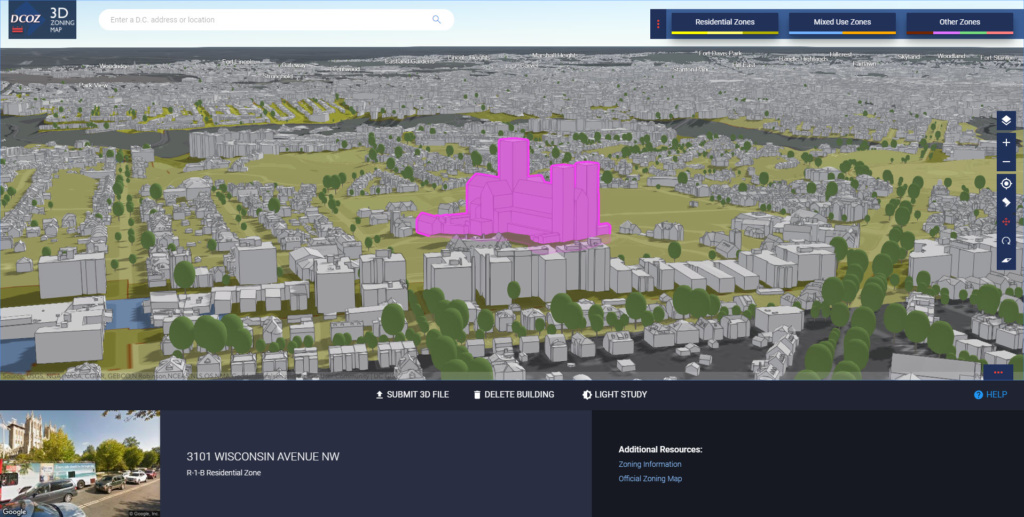
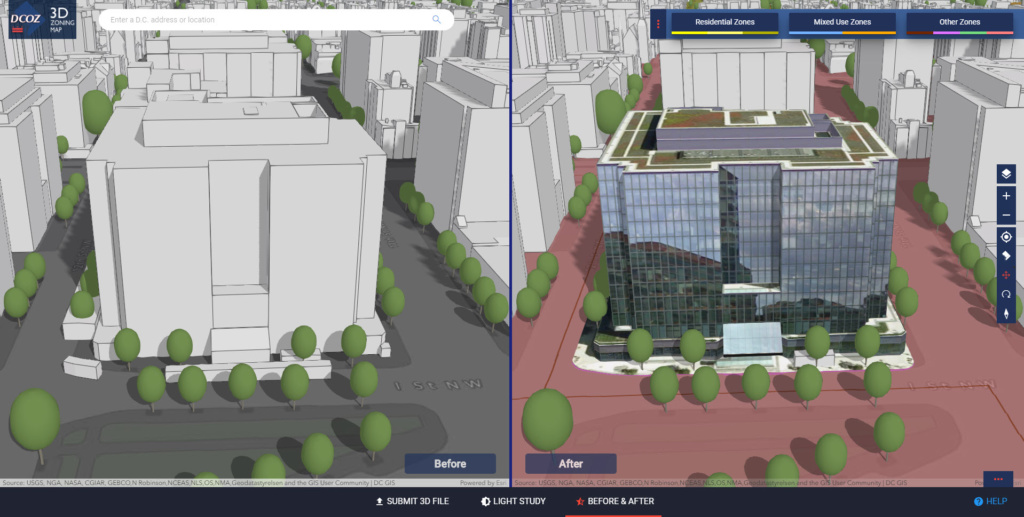
The Washington, DC Office of Zoning (DCOZ) provides assistance and oversight for the District of Columbia Zoning Commission (ZC) and Board of Zoning Adjustment (BZA). DCOZ reviews and accepts applications and enforces zoning criteria. With the help of Blue Raster, robust mapping and GIS tools provide citizens with general understanding and transparency around these criteria, rules and regulations. In 2016, Blue Raster and DCOZ collaborated to create the DC Zoning Map of 2016 and the Historical Zoning Mapping Application. New in 2018, we are excited to announce the next application in the series, the 3D Zoning Map. This new interactive map uses the latest geospatial and 3D technology to provide both residents and developers a tool to navigate and plan the District’s landscape.

DCOZ 3D Zoning image

To assist developers with visualizing what their project will look like against the current landscape, the 3D Zoning Map allows users to delete current buildings, upload new projects, and perform Before & After and Light Study analyses. Using Esri’s ArcGIS API for Javascript, data from DCOZ and the DC Office of the Chief Technology Officer (OCTO) is added to a Web Scene. Additionally, users have the ability to view zoning information from the Zoning Handbook and link to their address in the official Zoning Map.

DCOZ 3D Zoning imageThe 3D Zoning Map is an innovative public tool from DCOZ for citizens, developers, and agencies to collaborate and understand the zoning regulations in the nations Capitol.

“Our goal at DCOZ is to always be working towards greater transparency and to be increasing the amount of relevant information we can provide in interesting ways. It is our hope that the 3D Zoning Map will further demystify zoning and land use permitting in the District of Columbia and increase resident’s ability to participate in the process. We are excited to continue our partnership with Blue Raster through the release of the 3D Zoning Map.”  Matthew Holden, Zoning Data Coordinator, Office of Zoning | District of Columbia Government

China: Then and Now – A Story Map

Recently, Matthews Asia collaborated with Blue Raster to launch “China: Then and Now”, a new story map spotlighting China’s economic transformation. The story map explores China’s demographics, rapid adoption of mobile technology, and innovations in health care.

Story Map home screen

The story map begins with a historical overview of Ancient Chinese innovations, and then transitions into exploring today’s Modern China. It concludes with a look at how modern investors are incorporating investment opportunities in China to create globally diversified portfolios.

The making of the story map

To ensure the story map would be easy to navigate, easy to share, and easy to engage with, our team leveraged Esri’s Cascade story map template. To start, we created a color scheme and story board that reinforced the juxtaposition between Ancient and Modern China.

Mood board colors

To create a consistent storytelling narrative, we placed all graphics relating to Ancient China on the left side of the story map, and tinted them with warm shades reminiscent of Ancient Chinese traditions (Chinese lanterns, calligraphy, and architecture). We chose a palette of deep reds, warm yellows, and tans, and wove in pulp & paper-textures to continue the authentic feeling. To ensure the maps also felt authentic, our team customized a vector basemap to recreate the look of antique maps from that era.

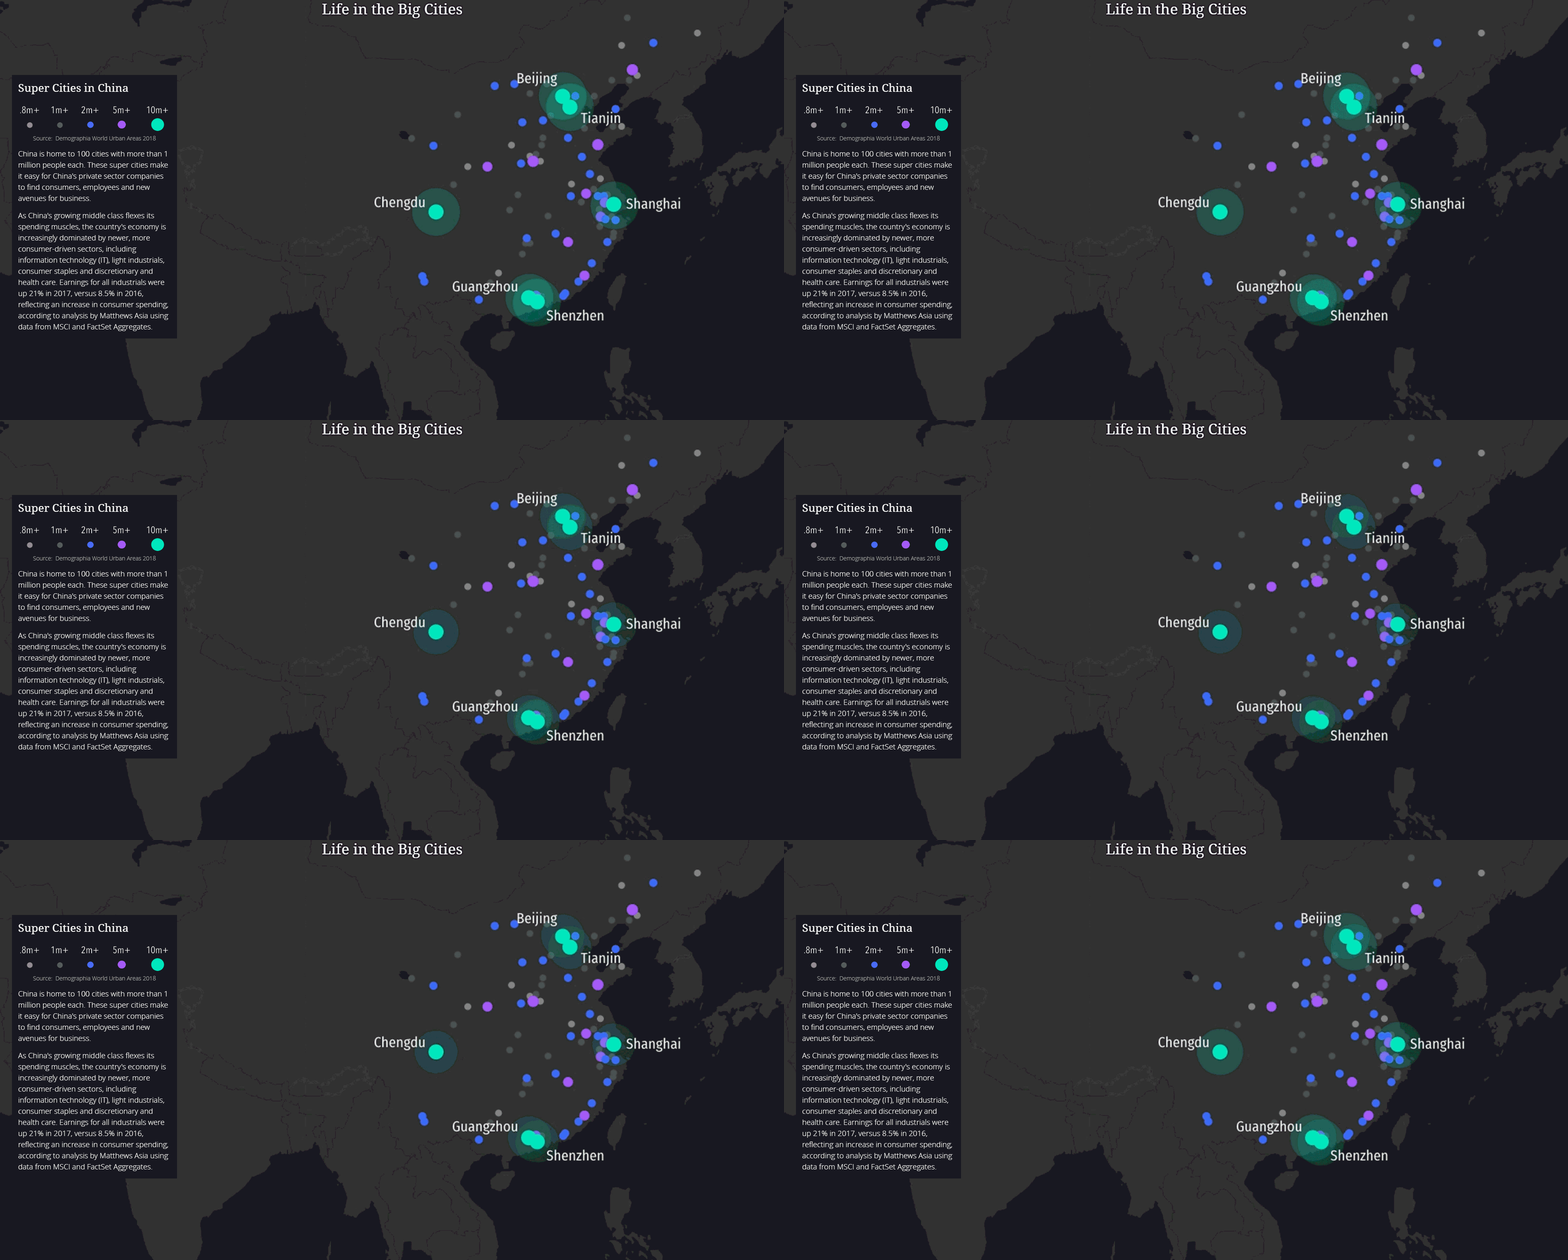
For Modern China, we placed visuals on the right side of the story map, and tinted them cool, neon tones that reinforced a futuristic, innovative feeling of today’s China.

Big cities in China

Work With Blue Raster to Share Your Story

Ready to dive into story maps? Contact our story map experts below to get started today.

  • This field is for validation purposes and should be left unchanged.

Or, get in touch by email: info@blueraster.com


Page 3 of 4