GIS

Blue Raster at NC GIS

Hey Ya'll ! Due to the Pandemic, the annual North Carolina GIS Conference was held virtually this year, from Feb 16-19, instead of the usual location of Winston-Salem. Blue Raster Program Manager Phil Satlof attended sessions, staffed the virtual "booth" and presented on the topic of Configurable apps like ArcGIS Dashboards, Extendable and Custom-Configurable applications.

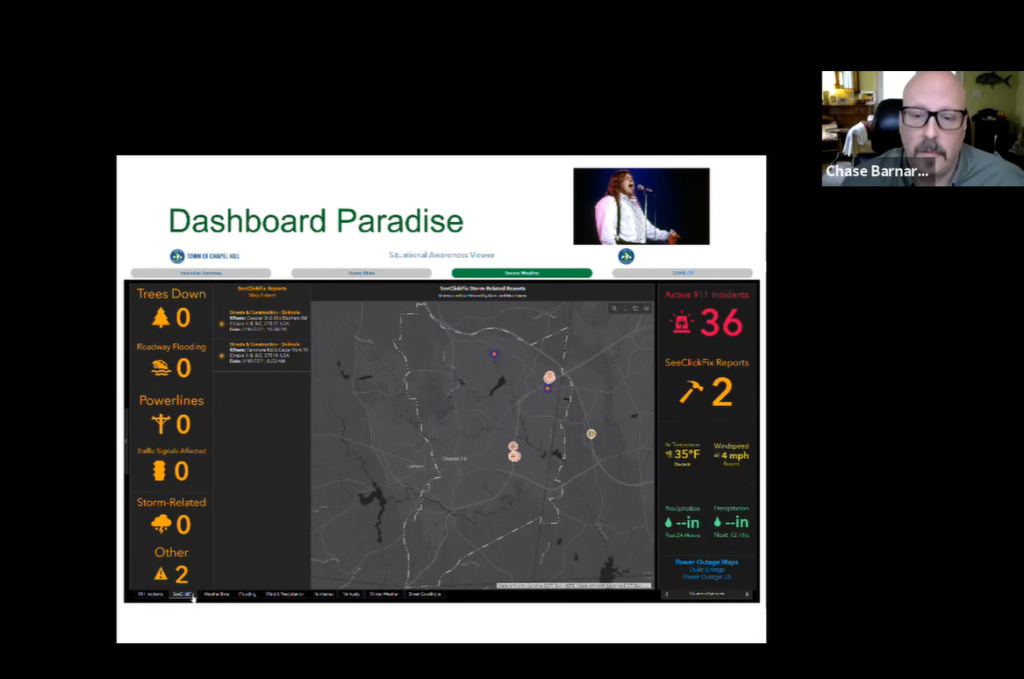
A highlight ofNC GIS Conference the conference for Blue Raster was when Chase Barnard and Dave Almond of the Town of Chapel Hill GIS Team presented "Paradise by the Operations Dashboard" which details the collaborative partnership forged between Blue Raster and the Town to refine ArcGIS Dashboards, Experience Builder Apps and create a custom workflow to pipe Computer Aided Dispatch data from the Orange County, NC 911 system into the Town ArcGIS Online account for use in a situational awareness dashboard.
Check back soon for more updates to this exciting workflow!


GIS Day 2020

Virtual GIS Day Celebration at Blue Raster

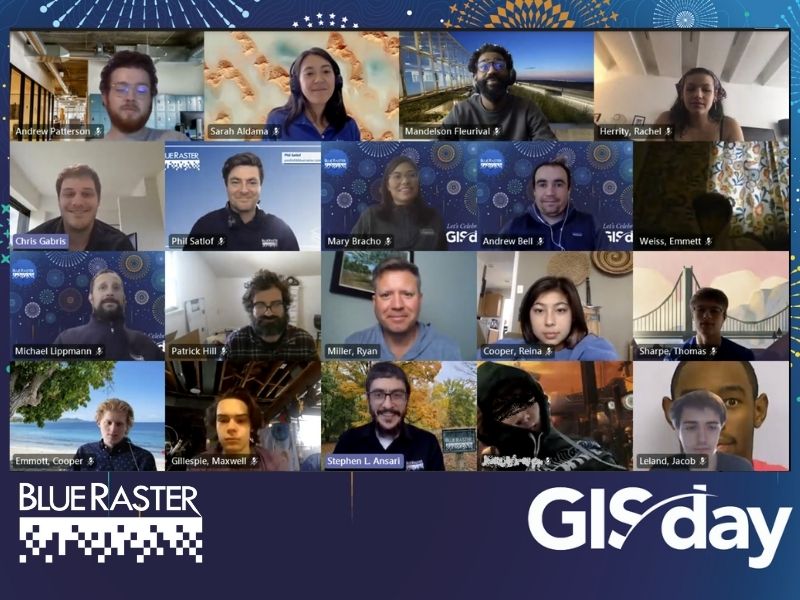
On November 18th, we celebrated GIS Day 2020 by hosting GIS students from Washington-Liberty High School. For the ninth year, Blue Raster hosted the class led by teacher Ryan Miller, providing students with a greater understanding of the work GIS professionals do in the world today. Unlike previous years, this year was the first-ever virtual celebration.

GIS Day 2020

The Blue Raster team shared some of the most recent real-world GIS success stories through a round of lighting talk presentation on recent and ongoing projects. From a distance, we were able to connect through the power of GIS technologies such as Collector for ArcGIS and ArcGIS Dashboards designed for a tree foliage field activity.

GIS Day Stars

GIS Day live stream
GIS Day live stream
GIS Day live stream
GIS Day at Blue Raster
Outside the Classroom

Additionally, this year we experienced the unique opportunity of hosting and being part of GIS Day with WJLA ABC7’s Outside the Classroom. Ryan Miller broadcast live from the Blue Raster Jungle and the Blue Raster team shared how we leverage on the power of storytelling using GIS data. The show was streamed live on both WJLA and Facebook. You can watch the Facebook recording here.

Read more about some of Blue Raster’s past GIS Day activities here.

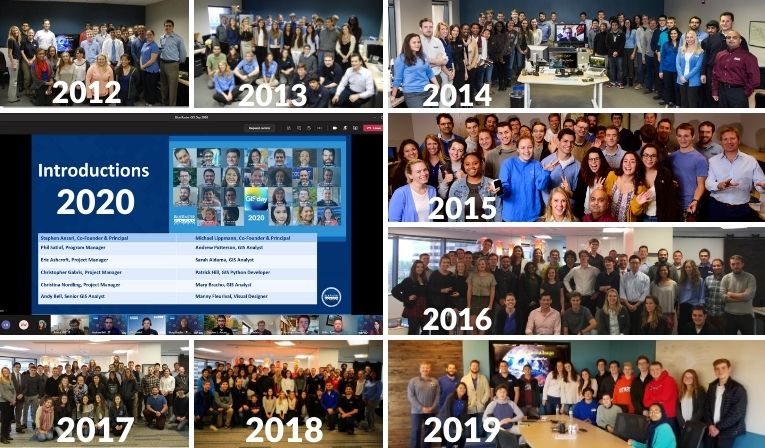
GIS Day through the years
  • Posted in
  • GIS

Intern Experience at Blue Raster: Summer 2020

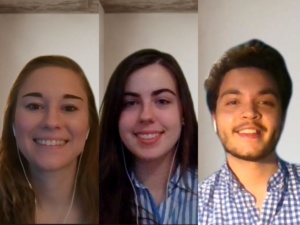
Another Blue Raster summer internship wrapped up this month. Beth, Victoria and Luke, this year’s GIS interns, spent the summer working from their homes developing GIS products and solutions on a wide variety of projects. Despite the COVID-19 pandemic, we worked remotely along with the rest of Blue Raster, jumping right in, and contributing to the team.

Intern photos
From left: Beth Wiberg, Victoria Dombrowik, Luke Watson-Sharer

On our first day, we immediately got our feet wet. Beth and Victoria began developing COVID-19 dashboards with Esri’s ArcGIS Dashboards while Luke utilized his Spanish in an ArcGIS StoryMap for the Meridian Institute. These initial projects were challenging for a new intern, but they prepared us to tackle more difficult projects and work more closely with clients. Over the course of the summer, we worked with a variety of clients: from private companies like Esri and Microsoft to NGOs and government agencies like The World Bank, Centers for Disease Control (CDC), World Wildlife Fund (WWF), and the Jane Goodall Institute. We contributed towards building and learning new GIS workflows to create the best possible products for our clients.

Examples of intern work

When asking Beth about her favorite project from this year, she said that “working on the World Bank Gender Based Violence app was my favorite project because it was one I got to see come to fruition. It was cool to see my contribution help move the project forward and work on an application that addresses a significant world-wide issue.”

Interns at the Esri UC

The Esri User Conference was one of the most rewarding experiences of our internship. The Plenary sessions, along with other sessions about new software and new geospatial tools, were available for us to view and participate in throughout the week. These sessions provided us the opportunity to learn about the recent trends within the industry, including many of the new products bring developed by Esri.

Part of being an intern is learning, and at Blue Raster we were very fortunate to see a new side of the GIS field through both the UC and hands-on, web based Esri application work experience. Many of the web applications became staples in everyday work and helped us improve our data visualization and mapping skills.

Intern UC

“Watching the Plenary sessions as a GIS team was a great experience, one I would not have had in the pre-coronavirus world. Seeing the roll-out of new features and products to incorporate into my own projects and ideas one day was an invaluable experience.”  Luke Watson-Sharer

Lessons Learned

From getting exposure to a wide variety of projects and clients to working closely in product development, we gained some key takeaways throughout this summer internship. Beth’s biggest takeaway pertains to the nature of remote internships, which she believed to be an invaluable experience. “It is possible to have a completely fulfilling virtual internship. Everyone was very accommodating and helpful with the unexpected situation we were in.” Our ability to collaborate virtually gave us the flexibility to work together to bring out the best in each other and we worked very closely together. As Victoria pointed out, we felt very close despite being remote. “Although this summer did not turn out how I expected, I never felt far away from the rest of the GIS team. I enjoyed the collaborative environment and that everyone I worked with had a different skill set.”

Virtual Bingo
Who knew Virtual Bingo would be so much fun?!

As the summer concludes, we all look forward to taking our skills and experiences from this internship into our future schoolwork and careers. Following this internship, Beth will finish up her bachelor’s degree at the Ohio State University in the fall. Luke will return to Clark University as a senior studying GIS and will begin his honors thesis this fall. Victoria will be returning to Yale University for her senior year, where she hopes to learn more about GIS development by enrolling in programming courses.

We hope to keep in touch with our coworkers at Blue Raster and are excited to see what the futures holds.

  • Posted in
  • GIS

Emerging Hot Spots and Tracking Global Forest Loss: A New Chapter in GIS for Science

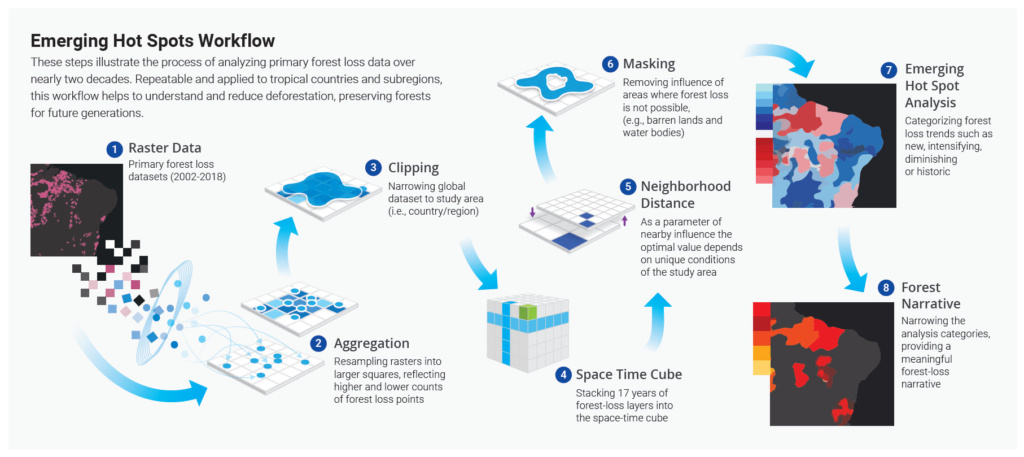
Deforestation impacts the environment in many ways. Habitat loss, desertification, increased greenhouse gas emissions, and climate change are just some of the negative effects. In an effort to understand trends in deforestion, Blue Raster collaborated with the World Resources Institute and Esri to publish a study about using spatial statistics to identify Emerging Hot Spots of forest loss. We are excited to announce that this work is part of a new publication.

GIS for Science

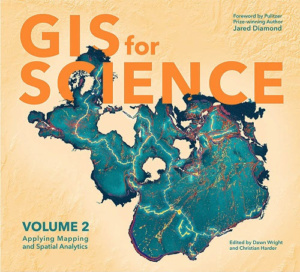
Featured in the new Esri Press book, GIS for Science, “Tracking Global Forest Loss” explores the study and the use of advanced geospatial tools to analyze and monitor forest loss throughout Brazil, Colombia, the Democratic Republic of the Congo, and Indonesia.

GIS for Science: Applying Mapping and Spatial Analytics, Volume 2 will officially be released in October 2020, but the pre-release volume is available digitally at this year’s Esri User Conference.

Using Esri’s Emerging Hot Spot Analysis, Blue Raster helped develop a workflow for mapping changes of deforestation through time and visualizing the impact of environmental policy across the world. The Emerging Hot Spot Analysis tool detects trends in data by analyzing new, intensifying, diminishing, and sporadic hot and cold spots. When analyzing for deforestation trends, Blue Raster worked to identify continual trends for hot spots of tree cover loss and cold spots of diminishing loss.

Tracking Global Forest Loss: Emerging Hot Spot Analysis

As the threat to our environment grows, scientists are working with cutting-edge GIS technology to help decision makers, technical experts and the broader public better understand trends in deforestation and improve future forest monitoring. With the ability to quantify deforestation loss over time, governments and other interest groups can create more effective policy over time.

COVID Response Dashboard

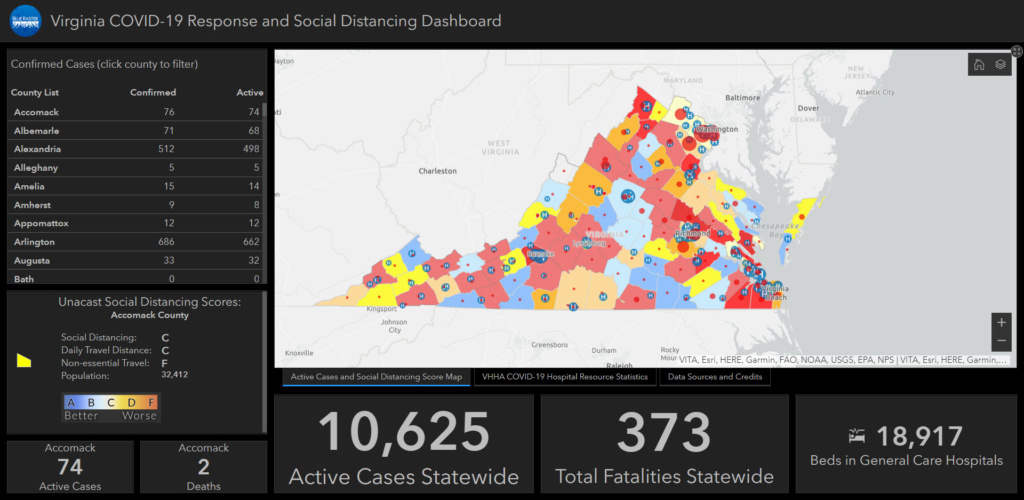
Over the past few weeks Blue Raster has been working to assist State and Federal Government agencies in the response to the COVID-19 outbreak. Providing a means to present accurate, up to date data to the public is essential to the success of mitigation efforts across the country. Blue Raster has been actively working to create Esri Operations Dashboards to do exactly that.

Virginia COVID-19 Social Distancing Dashboard

With Operations Dashboard for ArcGIS Online, Blue Raster created an interactive COVID response dashboard using Johns Hopkins University’s county level COVID-19 case data and Unacast’s Social Distancing Index to present crucial data in an easy to understand and consumable format. By using this data in a map-centric dashboard format with relevant figures, it allows for decision makers to view and understand the current situation and guide informed decision making.

Johns Hopkins COVID-19 dashboard has been used globally to track the spread of the Coronavirus outbreak since it was first recognized in early January. In the past weeks, the University has been able to release more granular county level data for the United States to improve tracking of the virus. The JHU county level data updates often with the latest case reporting from across the country.

Unacast’s Social Distancing Index, now available as a dataset in the Living Atlas and as a standalone map viewer application hosted by Esri, aggregates the average travel distance of residents in a county and their average visitation to non-essential locations. Additionally, it assigns each county in the US a letter grade to represent how well its residents are adhering to the CDC Social Distancing Guidelines.

Customizable Dashboard Template

The decision to use publicly available data allowed for the rapid turnaround of personalized dashboards for the state of Nevada and Virginia based off of the same core datasets available in the Esri Living Atlas. Key information from these datasets are then presented in an easy to understand operations dashboard to summarize the current situation of a state. This has also allowed Blue Raster to create a template based off of these dashboards. We can quickly configure and deploy this template for an organization's internal and external use. As a result, State and Local agencies can also use these dashboards as a collaboration tool to aid in decision making.

Ready to find out more?

Contact us today to get started on your own COVID response dashboard.


Page 7 of 12